
Concept explainers
Videos
(a)
To display these data with an appropriate graph.
(a)
Explanation of Solution
In the question, the prices of bananas reported from
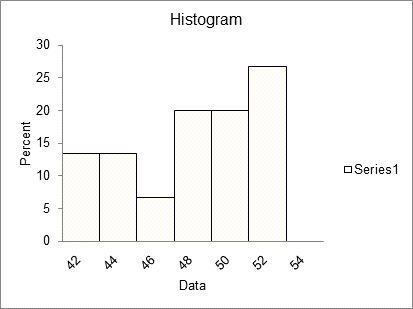
In the horizontal axis the prices of bananas are given and on the vertical axis the number of bananas are given.
(b)
To report appropriate summary statistics.
(b)
Explanation of Solution
In the question, the prices of bananas reported from
(c)
To write a few sentence about this distribution.
(c)
Explanation of Solution
In the question, the prices of bananas reported from
Want to see more full solutions like this?
Chapter PI Solutions
Stats: Modeling the World Nasta Edition Grades 9-12
Additional Math Textbook Solutions
Elementary Statistics Using Excel (6th Edition)
Introductory Statistics
Basic Business Statistics, Student Value Edition (13th Edition)
Introductory Statistics
Basic Business Statistics, Student Value Edition


 MATLAB: An Introduction with ApplicationsStatisticsISBN:9781119256830Author:Amos GilatPublisher:John Wiley & Sons Inc
 Probability and Statistics for Engineering and th...StatisticsISBN:9781305251809Author:Jay L. DevorePublisher:Cengage Learning
 Statistics for The Behavioral Sciences (MindTap C...StatisticsISBN:9781305504912Author:Frederick J Gravetter, Larry B. WallnauPublisher:Cengage Learning
 Elementary Statistics: Picturing the World (7th E...StatisticsISBN:9780134683416Author:Ron Larson, Betsy FarberPublisher:PEARSON
 The Basic Practice of StatisticsStatisticsISBN:9781319042578Author:David S. Moore, William I. Notz, Michael A. FlignerPublisher:W. H. Freeman
 Introduction to the Practice of StatisticsStatisticsISBN:9781319013387Author:David S. Moore, George P. McCabe, Bruce A. CraigPublisher:W. H. Freeman