
Concept explainers
Videos
(a)
To find the five-number summary.
(a)
Answer to Problem 38RE
Explanation of Solution
It is given in the question that the stem and leaf diagram is given which displays profits as a percent of sales for
(b)
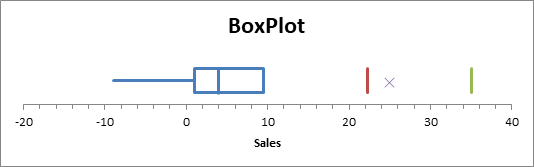
To draw a boxplot for these data.
(b)
Explanation of Solution
It is given in the question that the stem and leaf diagram is given which displays profits as a percent of sales for
(c)
To find the mean and standard deviation.
(c)
Answer to Problem 38RE
Explanation of Solution
It is given in the question that the stem and leaf diagram is given which displays profits as a percent of sales for
(d)
To describe the distribution of profits for these corporations.
(d)
Explanation of Solution
It is given in the question that the stem and leaf diagram is given which displays profits as a percent of sales for
Chapter PI Solutions
Stats: Modeling the World Nasta Edition Grades 9-12
Additional Math Textbook Solutions
Elementary Statistics
STATS:DATA+MODELS-W/DVD
Elementary Statistics Using Excel (6th Edition)
An Introduction to Mathematical Statistics and Its Applications (6th Edition)
Elementary Statistics (13th Edition)
Statistical Reasoning for Everyday Life (5th Edition)


 MATLAB: An Introduction with ApplicationsStatisticsISBN:9781119256830Author:Amos GilatPublisher:John Wiley & Sons Inc
 Probability and Statistics for Engineering and th...StatisticsISBN:9781305251809Author:Jay L. DevorePublisher:Cengage Learning
 Statistics for The Behavioral Sciences (MindTap C...StatisticsISBN:9781305504912Author:Frederick J Gravetter, Larry B. WallnauPublisher:Cengage Learning
 Elementary Statistics: Picturing the World (7th E...StatisticsISBN:9780134683416Author:Ron Larson, Betsy FarberPublisher:PEARSON
 The Basic Practice of StatisticsStatisticsISBN:9781319042578Author:David S. Moore, William I. Notz, Michael A. FlignerPublisher:W. H. Freeman
 Introduction to the Practice of StatisticsStatisticsISBN:9781319013387Author:David S. Moore, George P. McCabe, Bruce A. CraigPublisher:W. H. Freeman