
Concept explainers
Videos
(a)
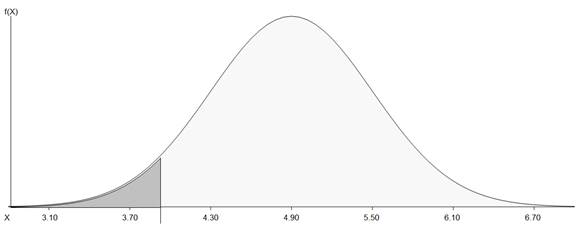
To draw and carefully label the model.
(a)
Explanation of Solution
In the question, it is given based on long-term investigation, researchers have suggested that the acidity of rainfall in the Shenandoah mountains can be described by the Normal model
(b)
To find out what percent of storms produce rainfall with pH over
(b)
Answer to Problem 8RE
Explanation of Solution
In the question, it is given based on long-term investigation, researchers have suggested that the acidity of rainfall in the Shenandoah mountains can be described by the Normal model
Thus, the percent of storms produce rainfall with pH over
(c)
To find out what percent of storms produce rainfall with pH under
(c)
Answer to Problem 8RE
Explanation of Solution
In the question, it is given based on long-term investigation, researchers have suggested that the acidity of rainfall in the Shenandoah mountains can be described by the Normal model
Thus, the percent of storms produce rainfall with pH under
(d)
To find out what is the pH level for the most acidic
(d)
Answer to Problem 8RE
The
Explanation of Solution
In the question, it is given based on long-term investigation, researchers have suggested that the acidity of rainfall in the Shenandoah mountains can be described by the Normal model
Thus, the value will be calculated as:
Thus, the
(e)
To find out what is the pH level for the least acidic
(e)
Answer to Problem 8RE
The
Explanation of Solution
In the question, it is given based on long-term investigation, researchers have suggested that the acidity of rainfall in the Shenandoah mountains can be described by the Normal model
Thus, the value will be calculated as:
Thus, the
(f)
To find out what is the IQR for the pH of rainfall.
(f)
Answer to Problem 8RE
Explanation of Solution
In the question, it is given based on long-term investigation, researchers have suggested that the acidity of rainfall in the Shenandoah mountains can be described by the Normal model
Therefore the IQR will be as:
And also,
Thus, we have,
Chapter PI Solutions
Stats: Modeling the World Nasta Edition Grades 9-12
Additional Math Textbook Solutions
Elementary Statistics: Picturing the World (6th Edition)
Introductory Statistics
Statistics: The Art and Science of Learning from Data (4th Edition)
Introductory Statistics (10th Edition)
Statistics for Business and Economics (13th Edition)


 MATLAB: An Introduction with ApplicationsStatisticsISBN:9781119256830Author:Amos GilatPublisher:John Wiley & Sons Inc
 Probability and Statistics for Engineering and th...StatisticsISBN:9781305251809Author:Jay L. DevorePublisher:Cengage Learning
 Statistics for The Behavioral Sciences (MindTap C...StatisticsISBN:9781305504912Author:Frederick J Gravetter, Larry B. WallnauPublisher:Cengage Learning
 Elementary Statistics: Picturing the World (7th E...StatisticsISBN:9780134683416Author:Ron Larson, Betsy FarberPublisher:PEARSON
 The Basic Practice of StatisticsStatisticsISBN:9781319042578Author:David S. Moore, William I. Notz, Michael A. FlignerPublisher:W. H. Freeman
 Introduction to the Practice of StatisticsStatisticsISBN:9781319013387Author:David S. Moore, George P. McCabe, Bruce A. CraigPublisher:W. H. Freeman