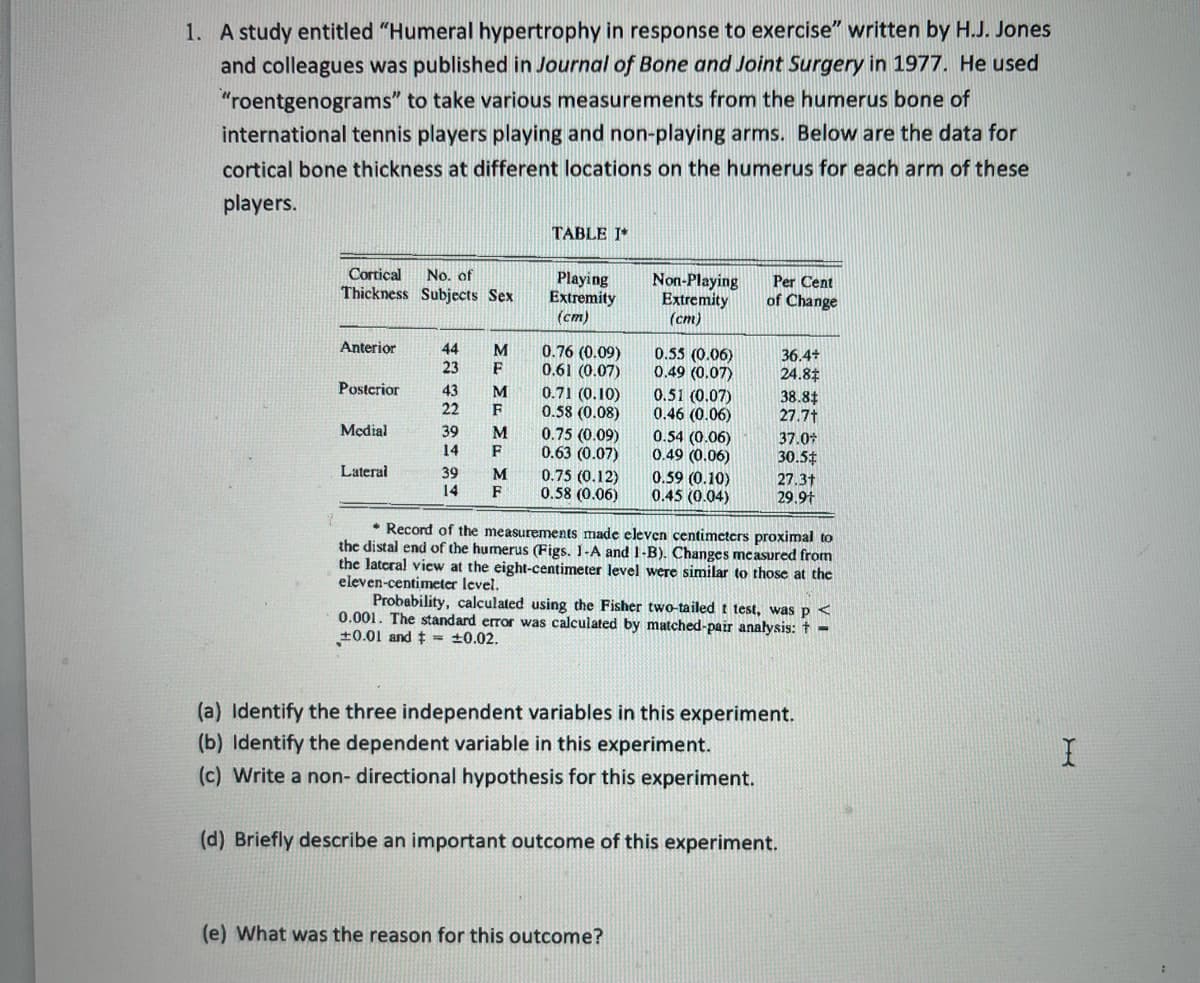
1. A study entitled "Humeral hypertrophy in response to exercise" written by H.J. Jones and colleagues was published in Journal of Bone and Joint Surgery in 1977. He used "roentgenograms" to take various measurements from the humerus bone of international tennis players playing and non-playing arms. Below are the data for cortical bone thickness at different locations on the humerus for each arm of these players. TABLE I* Non-Playing Extremity (cm) Per Cent Cortical Thickness Subjects Sex Playing Extremity (ст) No. of of Change 0.76 (0.09) 0.61 (0.07) 0.71 (0.10) 0.58 (0.08) 0.75 (0.09) 0.63 (0.07) 0.75 (0.12) 0.58 (0.06) 0.55 (0.06) 0.49 (0.07) 0.51 (0.07) 0.46 (0.06) 0.54 (0.06) 0.49 (0.06) 0.59 (0.10) 0.45 (0.04) 36.4+ 24.8 38.84 27.7t Anterior 44 23 Posterior 43 22 37.0* 30.5t Medial 39 14 27.3t 29.9t Lateral 39 14 Record of the measurements made eleven centimeters proximal to the distal end of the humerus (Figs. 1-A and 1-B). Changes measured from the lateral view at the eight-centimeter level were similar to those at the eleven-centimeter level. Probability, calculated using the Fisher two-tailed t test, was p < 0.001. The standard error was calculated by matched-pair analysis: + - +0.01 and t +0.02. (a) Identify the three independent variables in this experiment. (b) Identify the dependent variable in this experiment. (c) Write a non- directional hypothesis for this experiment. MFMFM1 ME
1. A study entitled "Humeral hypertrophy in response to exercise" written by H.J. Jones and colleagues was published in Journal of Bone and Joint Surgery in 1977. He used "roentgenograms" to take various measurements from the humerus bone of international tennis players playing and non-playing arms. Below are the data for cortical bone thickness at different locations on the humerus for each arm of these players. TABLE I* Non-Playing Extremity (cm) Per Cent Cortical Thickness Subjects Sex Playing Extremity (ст) No. of of Change 0.76 (0.09) 0.61 (0.07) 0.71 (0.10) 0.58 (0.08) 0.75 (0.09) 0.63 (0.07) 0.75 (0.12) 0.58 (0.06) 0.55 (0.06) 0.49 (0.07) 0.51 (0.07) 0.46 (0.06) 0.54 (0.06) 0.49 (0.06) 0.59 (0.10) 0.45 (0.04) 36.4+ 24.8 38.84 27.7t Anterior 44 23 Posterior 43 22 37.0* 30.5t Medial 39 14 27.3t 29.9t Lateral 39 14 Record of the measurements made eleven centimeters proximal to the distal end of the humerus (Figs. 1-A and 1-B). Changes measured from the lateral view at the eight-centimeter level were similar to those at the eleven-centimeter level. Probability, calculated using the Fisher two-tailed t test, was p < 0.001. The standard error was calculated by matched-pair analysis: + - +0.01 and t +0.02. (a) Identify the three independent variables in this experiment. (b) Identify the dependent variable in this experiment. (c) Write a non- directional hypothesis for this experiment. MFMFM1 ME

Glencoe Algebra 1, Student Edition, 9780079039897, 0079039898, 2018
18th Edition
ISBN:9780079039897
Author:Carter
Publisher:Carter
Chapter10: Statistics
Section10.1: Measures Of Center
Problem 9PPS

Related questions
Topic Video
Question
How do I solve questions A-E?
Transcribed Image Text:1. A study entitled "Humeral hypertrophy in response to exercise" written by H.J. Jones
and colleagues was published in Journal of Bone and Joint Surgery in 1977. He used
"roentgenograms" to take various measurements from the humerus bone of
international tennis players playing and non-playing arms. Below are the data for
cortical bone thickness at different locations on the humerus for each arm of these
players.
TABLE I*
Cortical
No. of
Playing
Extremity
(cm)
Non-Playing
Extremity
(cm)
Per Cent
Thickness Subjects Sex
of Change
Anterior
44
0.76 (0.09)
0.61 (0.07)
0.71 (0.10)
0.58 (0.08)
0.75 (0.09)
0.63 (0.07)
0.75 (0.12)
0.58 (0.06)
M
0.55 (0.06)
0.49 (0.07)
36.4+
24.8$
23
Postcrior
43
M
0.51 (0.07)
0.46 (0.06)
38.84
27.7t
22
F
Medial
39
M
0.54 (0.06)
0.49 (0.06)
37.0*
14
F
30.54
Lateral
39
14
M
F
0.59 (0.10)
0.45 (0.04)
27.3t
29.9t
* Record of the measurements made eleven centimeters proximal to
the distal end of the humerus (Figs. 1-A and 1-B). Changes measured from
the latcral view at the eight-centimeter level were similar to those at the
eleven-centimeter level.
Probability, calculated using the Fisher two-tailed t test, was p <
0.001. The standard error was calculated by matched-pair anałysis: + -
+0.01 and t = +0.02.
(a) Identify the three independent variables in this experiment.
(b) Identify the dependent variable in this experiment.
(c) Write a non- directional hypothesis for this experiment.
(d) Briefly describe an important outcome of this experiment.
(e) What was the reason for this outcome?
Expert Solution
This question has been solved!
Explore an expertly crafted, step-by-step solution for a thorough understanding of key concepts.

This is a popular solution!

Trending now
This is a popular solution!

Step by step
Solved in 3 steps

Knowledge Booster


Learn more about
Need a deep-dive on the concept behind this application? Look no further. Learn more about this topic, statistics and related others by exploring similar questions and additional content below.Recommended textbooks for you
Glencoe Algebra 1, Student Edition, 9780079039897…
Algebra
ISBN:
9780079039897
Author:
Carter
Publisher:
McGraw Hill
Glencoe Algebra 1, Student Edition, 9780079039897…
Algebra
ISBN:
9780079039897
Author:
Carter
Publisher:
McGraw Hill