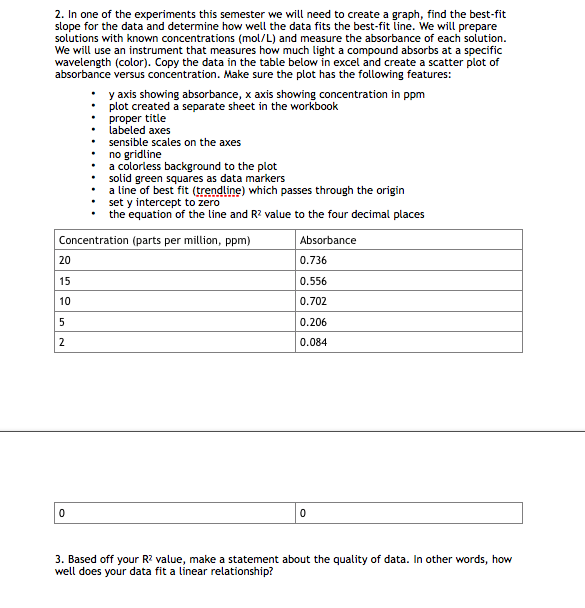
2. In one of the experiments this semester we will need to create a graph, find the best-fit slope for the data and determine how well the data fits the best-fit line. We will prepare solutions with known concentrations (mol/L) and measure the absorbance of each solution. We will use an instrument that measures how much light a compound absorbs at a specific wavelength (color). Copy the data in the table below in excel and create a scatter plot of absorbance versus concentration. Make sure the plot has the following features: y axis showing absorbance, x axis showing concentration in ppm plot created a separate sheet in the workbook • proper title labeled axes • sensible scales on the axes • no gridline • a colorless background to the plot solid green squares as data markers • a line of best fit (trendline) which passes through the origin set y intercept to zero the equation of the line and R? value to the four decimal places Concentration (parts per million, ppm) 20 Absorbance 0.736 15 0.556 10 0.702 0.206 2 0.084 3. Based off your R? value, make a statement about the quality of data. In other words, how well does your data fit a línear relationship?
2. In one of the experiments this semester we will need to create a graph, find the best-fit slope for the data and determine how well the data fits the best-fit line. We will prepare solutions with known concentrations (mol/L) and measure the absorbance of each solution. We will use an instrument that measures how much light a compound absorbs at a specific wavelength (color). Copy the data in the table below in excel and create a scatter plot of absorbance versus concentration. Make sure the plot has the following features: y axis showing absorbance, x axis showing concentration in ppm plot created a separate sheet in the workbook • proper title labeled axes • sensible scales on the axes • no gridline • a colorless background to the plot solid green squares as data markers • a line of best fit (trendline) which passes through the origin set y intercept to zero the equation of the line and R? value to the four decimal places Concentration (parts per million, ppm) 20 Absorbance 0.736 15 0.556 10 0.702 0.206 2 0.084 3. Based off your R? value, make a statement about the quality of data. In other words, how well does your data fit a línear relationship?
Principles of Instrumental Analysis
7th Edition
ISBN:9781305577213
Author:Douglas A. Skoog, F. James Holler, Stanley R. Crouch
Publisher:Douglas A. Skoog, F. James Holler, Stanley R. Crouch
Chapter1: Introduction
Section: Chapter Questions
Problem 1.3QAP
Related questions
Question
Please help

Transcribed Image Text:2. In one of the experiments this semester we will need to create a graph, find the best-fit
slope for the data and determine how well the data fits the best-fit line. We will prepare
solutions with known concentrations (mol/L) and measure the absorbance of each solution.
We will use an instrument that measures how much light a compound absorbs at a specific
wavelength (color). Copy the data in the table below in excel and create a scatter plot of
absorbance versus concentration. Make sure the plot has the following features:
y axis showing absorbance, x axis showing concentration in ppm
plot created a separate sheet in the workbook
proper títle
labeled axes
sensible scales on the axes
no gridline
a colorless background to the plot
solid green squares as data markers
a line of best fit (trendline) which passes through the origin
set y intercept to zero
the equation of the line and R? value to the four decimal places
Concentration (parts per million, ppm)
Absorbance
20
0.736
15
0.556
10
0.702
0.206
2
0.084
3. Based off your R? value, make a statement about the quality of data. In other words, how
well does your data fit a linear relationship?

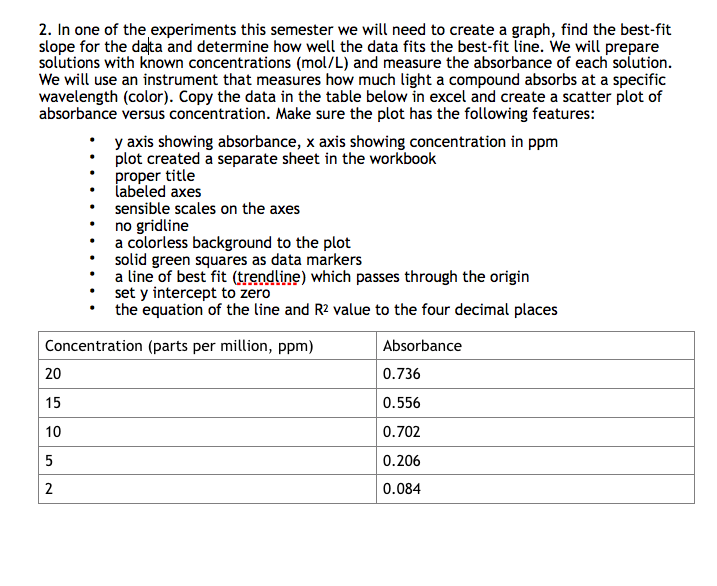
Transcribed Image Text:2. In one of the experiments this semester we will need to create a graph, find the best-fit
slope for the data and determine how well the data fits the best-fit line. We will prepare
solutions with known concentrations (mol/L) and measure the absorbance of each solution.
We will use an instrument that measures how much light a compound absorbs at a specific
wavelength (color). Copy the data in the table below in excel and create a scatter plot of
absorbance versus concentration. Make sure the plot has the following features:
y axis showing absorbance, x axis showing concentration in ppm
plot created a separate sheet in the workbook
proper title
labeled axes
sensible scales on the axes
no gridline
a colorless background to the plot
solid green squares as data markers
a line of best fit (trendline) which passes through the origin
set y intercept to zero
the equation of the line and R2 value to the four decimal places
Concentration (parts per million, ppm)
Absorbance
20
0.736
15
0.556
10
0.702
5
0.206
2
0.084
Expert Solution
This question has been solved!
Explore an expertly crafted, step-by-step solution for a thorough understanding of key concepts.
This is a popular solution!
Trending now
This is a popular solution!
Step by step
Solved in 4 steps with 3 images

Recommended textbooks for you

Principles of Instrumental Analysis
Chemistry
ISBN:
9781305577213
Author:
Douglas A. Skoog, F. James Holler, Stanley R. Crouch
Publisher:
Cengage Learning

Principles of Instrumental Analysis
Chemistry
ISBN:
9781305577213
Author:
Douglas A. Skoog, F. James Holler, Stanley R. Crouch
Publisher:
Cengage Learning