b) Compute the CL, UCL and LCL of the given data using k 3. Construct an X-bar chart. Sample Number Observations 1 32 36 42 28 32 40 3 39 52 28 4 50 42 31 5 42 45 34
b) Compute the CL, UCL and LCL of the given data using k 3. Construct an X-bar chart. Sample Number Observations 1 32 36 42 28 32 40 3 39 52 28 4 50 42 31 5 42 45 34

College Algebra (MindTap Course List)
12th Edition
ISBN:9781305652231
Author:R. David Gustafson, Jeff Hughes
Publisher:R. David Gustafson, Jeff Hughes
Chapter8: Sequences, Series, And Probability
Section8.7: Probability
Problem 7E: List the sample space of each experiment. Selecting a letter of the alphabet

Related questions
Question
Hi. Please answer only B in this question because I already got the answer to A. Also, can you show me how to get the UCL and LCL without using control constants? Thank you! I've provided the formula that should be used.
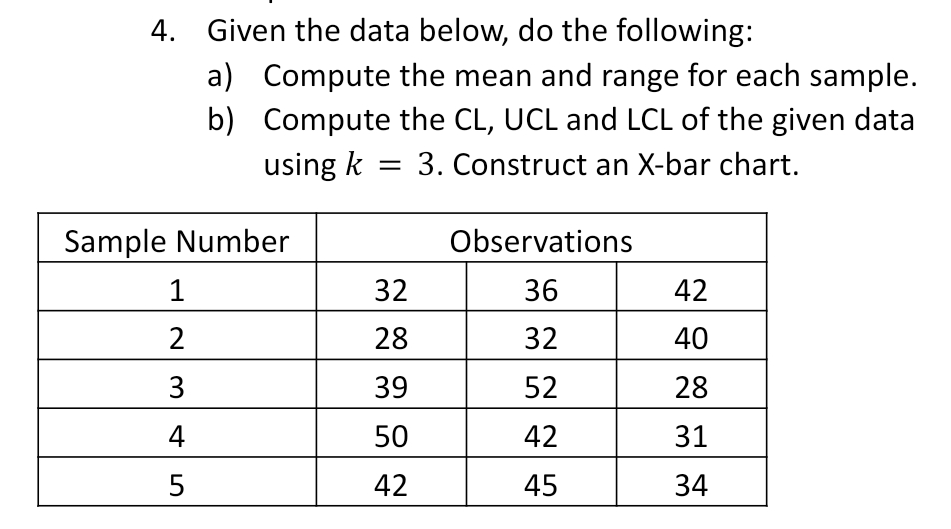
Transcribed Image Text:4. Given the data below, do the following:
a) Compute the mean and range for each sample.
b) Compute the CL, UCL and LCL of the given data
using k
3. Construct an X-bar chart.
Sample Number
Observations
1
32
36
42
2
28
32
40
3
39
52
28
4
50
42
31
5
42
45
34
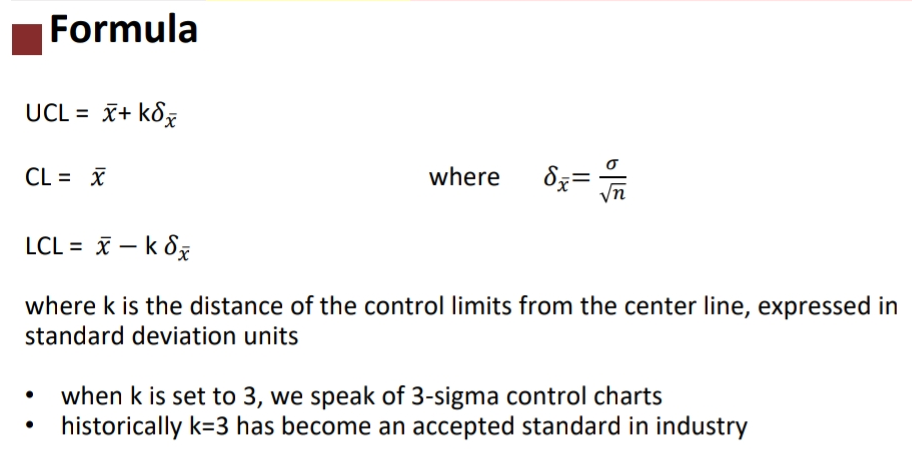
Transcribed Image Text:Formula
UCL = x+ kd
CL = X
83=
dz=
where
LCL = x – k 8z
where k is the distance of the control limits from the center line, expressed in
standard deviation units
when k is set to 3, we speak of 3-sigma control charts
historically k=3 has become an accepted standard in industry
Expert Solution
This question has been solved!
Explore an expertly crafted, step-by-step solution for a thorough understanding of key concepts.

This is a popular solution!

Trending now
This is a popular solution!

Step by step
Solved in 3 steps with 2 images

Recommended textbooks for you
College Algebra (MindTap Course List)
Algebra
ISBN:
9781305652231
Author:
R. David Gustafson, Jeff Hughes
Publisher:
Cengage Learning
College Algebra (MindTap Course List)
Algebra
ISBN:
9781305652231
Author:
R. David Gustafson, Jeff Hughes
Publisher:
Cengage Learning