(b) Develop a three-week moving average for this time series. Compute MSE and a forecast for week 7. If required, round your answers to two decimal places. Week Value Forecast 1 16 2 15 17 4 13 16 6 13 MSE: The forecast for week 7: (c) Use a = 0.2 to compute the exponential smoothing values for the time series. Compute MSE and a forecast for week 7. If required, round your answers to two decimal places. Week Value Forecast 1 16 2 15 3 17 4 13 5 16 6 13 MSE: The forecast for week 7: LO
(b) Develop a three-week moving average for this time series. Compute MSE and a forecast for week 7. If required, round your answers to two decimal places. Week Value Forecast 1 16 2 15 17 4 13 16 6 13 MSE: The forecast for week 7: (c) Use a = 0.2 to compute the exponential smoothing values for the time series. Compute MSE and a forecast for week 7. If required, round your answers to two decimal places. Week Value Forecast 1 16 2 15 3 17 4 13 5 16 6 13 MSE: The forecast for week 7: LO

Glencoe Algebra 1, Student Edition, 9780079039897, 0079039898, 2018
18th Edition
ISBN:9780079039897
Author:Carter
Publisher:Carter
Chapter10: Statistics
Section10.5: Comparing Sets Of Data
Problem 11PPS

Related questions
Question
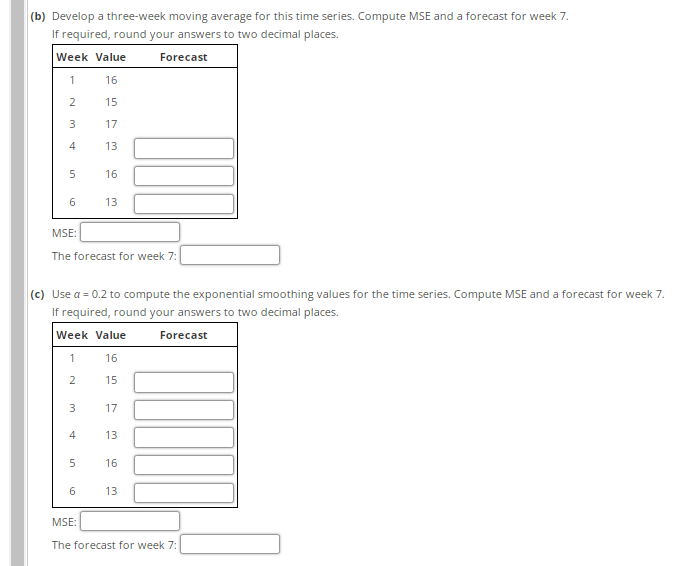
Transcribed Image Text:(b) Develop a three-week moving average for this time series. Compute MSE and a forecast for week 7.
If required, round your answers to two decimal places.
Week Value
Forecast
1
16
2
15
17
4
13
16
6
13
MSE:
The forecast for week 7:
(c) Use a = 0.2 to compute the exponential smoothing values for the time series. Compute MSE and a forecast for week 7.
If required, round your answers to two decimal places.
Week Value
Forecast
1
16
2
15
3
17
4
13
5
16
6
13
MSE:
The forecast for week 7:
LO
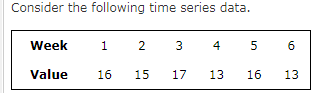
Transcribed Image Text:Consider the following time series data.
Week
1
4
5
6
Value
16
15
17
13
16
13
3.
Expert Solution
This question has been solved!
Explore an expertly crafted, step-by-step solution for a thorough understanding of key concepts.

This is a popular solution!

Trending now
This is a popular solution!

Step by step
Solved in 2 steps with 2 images

Recommended textbooks for you
Glencoe Algebra 1, Student Edition, 9780079039897…
Algebra
ISBN:
9780079039897
Author:
Carter
Publisher:
McGraw Hill
Glencoe Algebra 1, Student Edition, 9780079039897…
Algebra
ISBN:
9780079039897
Author:
Carter
Publisher:
McGraw Hill