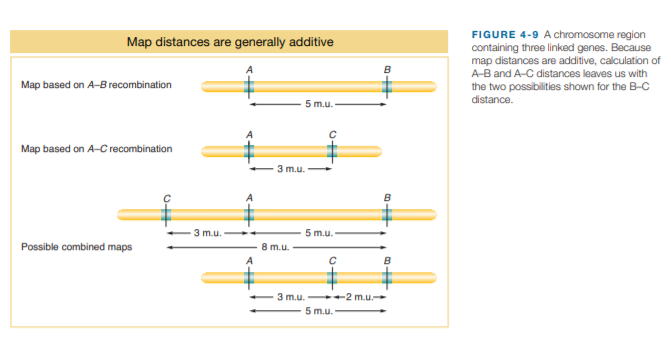
FIGURE 4-9 Achromosome region containing three linked genes. Because map distances are additive, calculation of A-B and A-C distances leaves us with Map distances are generally additive B Map based on A-B recombination the two possibilities shown for the B-C distance. 5 m.u. Map based on A-C recombination 3 m.u. A 3 m.u. 5 m.u. Possible combined maps 8 m.u. A 3 m.u. -2 m.u. 5 m.u.
FIGURE 4-9 Achromosome region containing three linked genes. Because map distances are additive, calculation of A-B and A-C distances leaves us with Map distances are generally additive B Map based on A-B recombination the two possibilities shown for the B-C distance. 5 m.u. Map based on A-C recombination 3 m.u. A 3 m.u. 5 m.u. Possible combined maps 8 m.u. A 3 m.u. -2 m.u. 5 m.u.

Chapter15: Biotechnology
Section: Chapter Questions
Problem 2CT: The results of a paternity test are shown in the table below. Numbers indicate the number of short...

Related questions

Topic Video
Question
In Figure 4-9, why is only locus A shown in a constant
position?
Transcribed Image Text:FIGURE 4-9 Achromosome region
containing three linked genes. Because
map distances are additive, calculation of
A-B and A-C distances leaves us with
Map distances are generally additive
B
Map based on A-B recombination
the two possibilities shown for the B-C
distance.
5 m.u.
Map based on A-C recombination
3 m.u.
A
3 m.u.
5 m.u.
Possible combined maps
8 m.u.
A
3 m.u. -2 m.u.
5 m.u.
Expert Solution
This question has been solved!
Explore an expertly crafted, step-by-step solution for a thorough understanding of key concepts.

This is a popular solution!

Trending now
This is a popular solution!

Step by step
Solved in 4 steps

Knowledge Booster


Learn more about
Need a deep-dive on the concept behind this application? Look no further. Learn more about this topic, biology and related others by exploring similar questions and additional content below.Recommended textbooks for you