hom Lab 14 Kinetics of the Reaction of Phenolphthalein with NaOH nur loc Procedure Note: The total ion concentration (the ionic strength) of all the runs must be constant. This factor is important because the reaction rate depends on the total number of ions in solution. (The reaction involves the approach of two negatively charged ions and how much their mutual repulsion is decreased depends on the concentration of the ions in the environment.) A constant ionic strength will be maintained in the solutions by diluting the NAOH solution with a NaCl solution instead of DI water so that the total concentration of ions present in the solutions is constant. hc er Preparation of Standard Solutions 1. Prepare 50.0 mL of 0.300 M NAOH solution by diluting an appropriate volume of 6.00 M NAOH Using a variable volume pipet, add the volume of 6.00 M NaOH to a 50.0 mL volumetric flask, dilute to the mark with DI water, and mix well. Transfer the solution to a beaker labeled "0.300 M NAOH'". ift Prepare 50.0 mL of 0.300 M NaCl solution by dissolving an appropriate mass of NaCl. Weigh the mass of NaCl and quantitatively transfer it to a 50.0 mL volumetric flask. Add a small amount of deionized water, swirl to dissolve the salt, then dilute to the mark with deionized water and mix well. Transfer the solution to 2. a beaker labeled "0.300 M NaCl". Setting up the LabQuest and SpectroVis Spectrophotometer 3. To use the Vernier LabQuest handheld device to collect absorption data in this lab, begin by plugging the spectrophotometer into the LabQuest and turn it on. You will see a light inside the cuvette holder. 4. Choose Data Collection from the Sensors menu. On the data collection screen, change the mode to Time Based, then tap OK. 5. To set the wavelength, tap the red box displaying the absorbance. Choose Change Wavelength from the menu that appears. Enter "550", then tap OK. When the unit returns to displaying the absorbance, the sidebar will show approximately 550 nm. hp EF a la' it 6. Fill a cuvette 4 full with DI water and place the cuvette in the sample compartment. Note: The light path of the instrument is marked inside the cell compartment. Make certain the light path passes through the clear faces of the cuvette. OLUFS 7. Choose Calibrate from the Sensors menu or the menu that appears after tapping the absorbance box. Wait the 90 seconds for the lamp to stabilize, then tap Finish Calibration followed by OK. 0-edge dis ang & Olu 8. Remove the water cuvette. Run 1 9. Fill a cuvette 4 full with 0.300 M NaOH. 10. Add one small drop of phenolphthalein solution and invert to mix. 11. Place the cuvette in the spectrophotometer. The absorbance reading will appear. We are only using the LabQuest to measure the absorbance, not as a data Note: Do NOT tap Collect collection device. 12. Wait to start recording the time and absorbance in your lab notebook and the report sheet until the reading is between 1.0 and 0.4. If the initial absorbance is below 0.4, remove the cuvette, add a small drop of phenolphthalein solution, invert to mix, and place the cuvette back into the spectrophotometer. Begin timing when you record your first absorbance reading; this is time zero. All other times are recorded relative to time zero. Note: Your instructor may give you alternate directions regarding when to begin recording your data. 13. Record the absorbance every 30. seconds after your initial reading for a total of 180. seconds. 14. When done with the run, remove the cuvette and rinse it with DI water. 144 Lab 14 Run 2 Kinetics of the Reaction of Phenolphthalein with NaOH 15. Pipet 20.0 mL of 0.300 M NaOH solution into a small beaker and pipet 10.0 mL of 0.300 M Nach o ta Mix the solution well. 16. Repeat Steps 9-14 using the resulting solution from Step 15 in place of the 0.300 M NAOH solution and recording the absorbance every 60. seconds for a total of 360. seconds. Run 3 Note: Reaction rates are a function of temperature. It is important that the solutions do not change temperature during the course of the reaction. The cuvettes containing the two lower concentrations of hydroxide ion (Runs 3 and 4) should be removed from the spectrophotometer's light path between readings to prevent the solutions from warming. 17. Pipet 10.0 mL of the solution created for Run 2 into a small beaker and pipet 10.0 mL of 0.300 M NaCI into it. Mix the solution well. 18. Repeat Steps 9-14 using the resulting solution from Step 17 in place of the 0.300 M NAOH solution and recording the absorbance every 120. seconds for a total of 720. seconds. Run 4 19. Pipet 10.0 mL of the solution created for Run 3 into a small beaker and pipet 10.0 mL of 0.300 M NaCi into it. Mix the solution well. 20. Repeat Steps 9-14 using the resulting solution from Step 19 in place of the 0.300 M NAOH solution and recording the absorbance every 120. seconds for a total of 720. seconds. Data Analysis Prepare the following graphs (six in total) as an x-y scatter plot using Excel or another spreadsheet software (see Appendix II). All graphs must be appropriately labeled. For Run 1, prepare two separate graphs, one of In(A) vs. time, the other of 1/A vs. time. Compare how linear the two graphs are. If the reaction is first-order with respect to phenolphthalein, the graph of In(A) vs. time will be linear. If the reaction is second-order with respect to phenolphthalein, the graph of 1/A vs. time will be linear. For each of Runs 2-4, prepare a graph of In(A) vs. time. For each of the four graphs of In(A) vs. time, find the slope of the trendline and calculate k1. (Recall that ki =-slope.) Determine the concentration of OH used for each of the four runs by considering how the NaOH solution was diluted for each run. (Hint: MIV1 = M2V2.) Prepare a graph of ki vs. [OH]]. If the graph is linear, the reaction is first-order with respect to [OH]. %3D The slope of the line for the graph of ki vs. [OH¯]is equal to the overall rate constant, k. Determine k for the reaction (including units) and report the overall rate law for the reaction. For Your Consideration How does the process of preparing an aqueous solution of known concentration from a stock solution differ from preparing one from pure solid solute? Would the concentration of OH in the solutions used for Runs 2-4 be different if deionized water was used to prepare them instead of aqueous NaCl solution? Why is an aqueous solution of NaCl used to prepare the solutions for Runs 2-4 instead of deionized water? How might you experimentally distinguish between a first-order and second-order kinetic reaction? 14-5
hom Lab 14 Kinetics of the Reaction of Phenolphthalein with NaOH nur loc Procedure Note: The total ion concentration (the ionic strength) of all the runs must be constant. This factor is important because the reaction rate depends on the total number of ions in solution. (The reaction involves the approach of two negatively charged ions and how much their mutual repulsion is decreased depends on the concentration of the ions in the environment.) A constant ionic strength will be maintained in the solutions by diluting the NAOH solution with a NaCl solution instead of DI water so that the total concentration of ions present in the solutions is constant. hc er Preparation of Standard Solutions 1. Prepare 50.0 mL of 0.300 M NAOH solution by diluting an appropriate volume of 6.00 M NAOH Using a variable volume pipet, add the volume of 6.00 M NaOH to a 50.0 mL volumetric flask, dilute to the mark with DI water, and mix well. Transfer the solution to a beaker labeled "0.300 M NAOH'". ift Prepare 50.0 mL of 0.300 M NaCl solution by dissolving an appropriate mass of NaCl. Weigh the mass of NaCl and quantitatively transfer it to a 50.0 mL volumetric flask. Add a small amount of deionized water, swirl to dissolve the salt, then dilute to the mark with deionized water and mix well. Transfer the solution to 2. a beaker labeled "0.300 M NaCl". Setting up the LabQuest and SpectroVis Spectrophotometer 3. To use the Vernier LabQuest handheld device to collect absorption data in this lab, begin by plugging the spectrophotometer into the LabQuest and turn it on. You will see a light inside the cuvette holder. 4. Choose Data Collection from the Sensors menu. On the data collection screen, change the mode to Time Based, then tap OK. 5. To set the wavelength, tap the red box displaying the absorbance. Choose Change Wavelength from the menu that appears. Enter "550", then tap OK. When the unit returns to displaying the absorbance, the sidebar will show approximately 550 nm. hp EF a la' it 6. Fill a cuvette 4 full with DI water and place the cuvette in the sample compartment. Note: The light path of the instrument is marked inside the cell compartment. Make certain the light path passes through the clear faces of the cuvette. OLUFS 7. Choose Calibrate from the Sensors menu or the menu that appears after tapping the absorbance box. Wait the 90 seconds for the lamp to stabilize, then tap Finish Calibration followed by OK. 0-edge dis ang & Olu 8. Remove the water cuvette. Run 1 9. Fill a cuvette 4 full with 0.300 M NaOH. 10. Add one small drop of phenolphthalein solution and invert to mix. 11. Place the cuvette in the spectrophotometer. The absorbance reading will appear. We are only using the LabQuest to measure the absorbance, not as a data Note: Do NOT tap Collect collection device. 12. Wait to start recording the time and absorbance in your lab notebook and the report sheet until the reading is between 1.0 and 0.4. If the initial absorbance is below 0.4, remove the cuvette, add a small drop of phenolphthalein solution, invert to mix, and place the cuvette back into the spectrophotometer. Begin timing when you record your first absorbance reading; this is time zero. All other times are recorded relative to time zero. Note: Your instructor may give you alternate directions regarding when to begin recording your data. 13. Record the absorbance every 30. seconds after your initial reading for a total of 180. seconds. 14. When done with the run, remove the cuvette and rinse it with DI water. 144 Lab 14 Run 2 Kinetics of the Reaction of Phenolphthalein with NaOH 15. Pipet 20.0 mL of 0.300 M NaOH solution into a small beaker and pipet 10.0 mL of 0.300 M Nach o ta Mix the solution well. 16. Repeat Steps 9-14 using the resulting solution from Step 15 in place of the 0.300 M NAOH solution and recording the absorbance every 60. seconds for a total of 360. seconds. Run 3 Note: Reaction rates are a function of temperature. It is important that the solutions do not change temperature during the course of the reaction. The cuvettes containing the two lower concentrations of hydroxide ion (Runs 3 and 4) should be removed from the spectrophotometer's light path between readings to prevent the solutions from warming. 17. Pipet 10.0 mL of the solution created for Run 2 into a small beaker and pipet 10.0 mL of 0.300 M NaCI into it. Mix the solution well. 18. Repeat Steps 9-14 using the resulting solution from Step 17 in place of the 0.300 M NAOH solution and recording the absorbance every 120. seconds for a total of 720. seconds. Run 4 19. Pipet 10.0 mL of the solution created for Run 3 into a small beaker and pipet 10.0 mL of 0.300 M NaCi into it. Mix the solution well. 20. Repeat Steps 9-14 using the resulting solution from Step 19 in place of the 0.300 M NAOH solution and recording the absorbance every 120. seconds for a total of 720. seconds. Data Analysis Prepare the following graphs (six in total) as an x-y scatter plot using Excel or another spreadsheet software (see Appendix II). All graphs must be appropriately labeled. For Run 1, prepare two separate graphs, one of In(A) vs. time, the other of 1/A vs. time. Compare how linear the two graphs are. If the reaction is first-order with respect to phenolphthalein, the graph of In(A) vs. time will be linear. If the reaction is second-order with respect to phenolphthalein, the graph of 1/A vs. time will be linear. For each of Runs 2-4, prepare a graph of In(A) vs. time. For each of the four graphs of In(A) vs. time, find the slope of the trendline and calculate k1. (Recall that ki =-slope.) Determine the concentration of OH used for each of the four runs by considering how the NaOH solution was diluted for each run. (Hint: MIV1 = M2V2.) Prepare a graph of ki vs. [OH]]. If the graph is linear, the reaction is first-order with respect to [OH]. %3D The slope of the line for the graph of ki vs. [OH¯]is equal to the overall rate constant, k. Determine k for the reaction (including units) and report the overall rate law for the reaction. For Your Consideration How does the process of preparing an aqueous solution of known concentration from a stock solution differ from preparing one from pure solid solute? Would the concentration of OH in the solutions used for Runs 2-4 be different if deionized water was used to prepare them instead of aqueous NaCl solution? Why is an aqueous solution of NaCl used to prepare the solutions for Runs 2-4 instead of deionized water? How might you experimentally distinguish between a first-order and second-order kinetic reaction? 14-5

Chapter1: Lewis Structures
Section: Chapter Questions
Problem 63EQ

Related questions
Question
I need help finding the molarity of NaOH for run 2-4. I know the molarity for run one was 0.300M and that I have to use the M1V1=M2V2 formula but I don't know how to solve for it. I included the procedures we followed to make each dilution solution.
Transcribed Image Text:hom
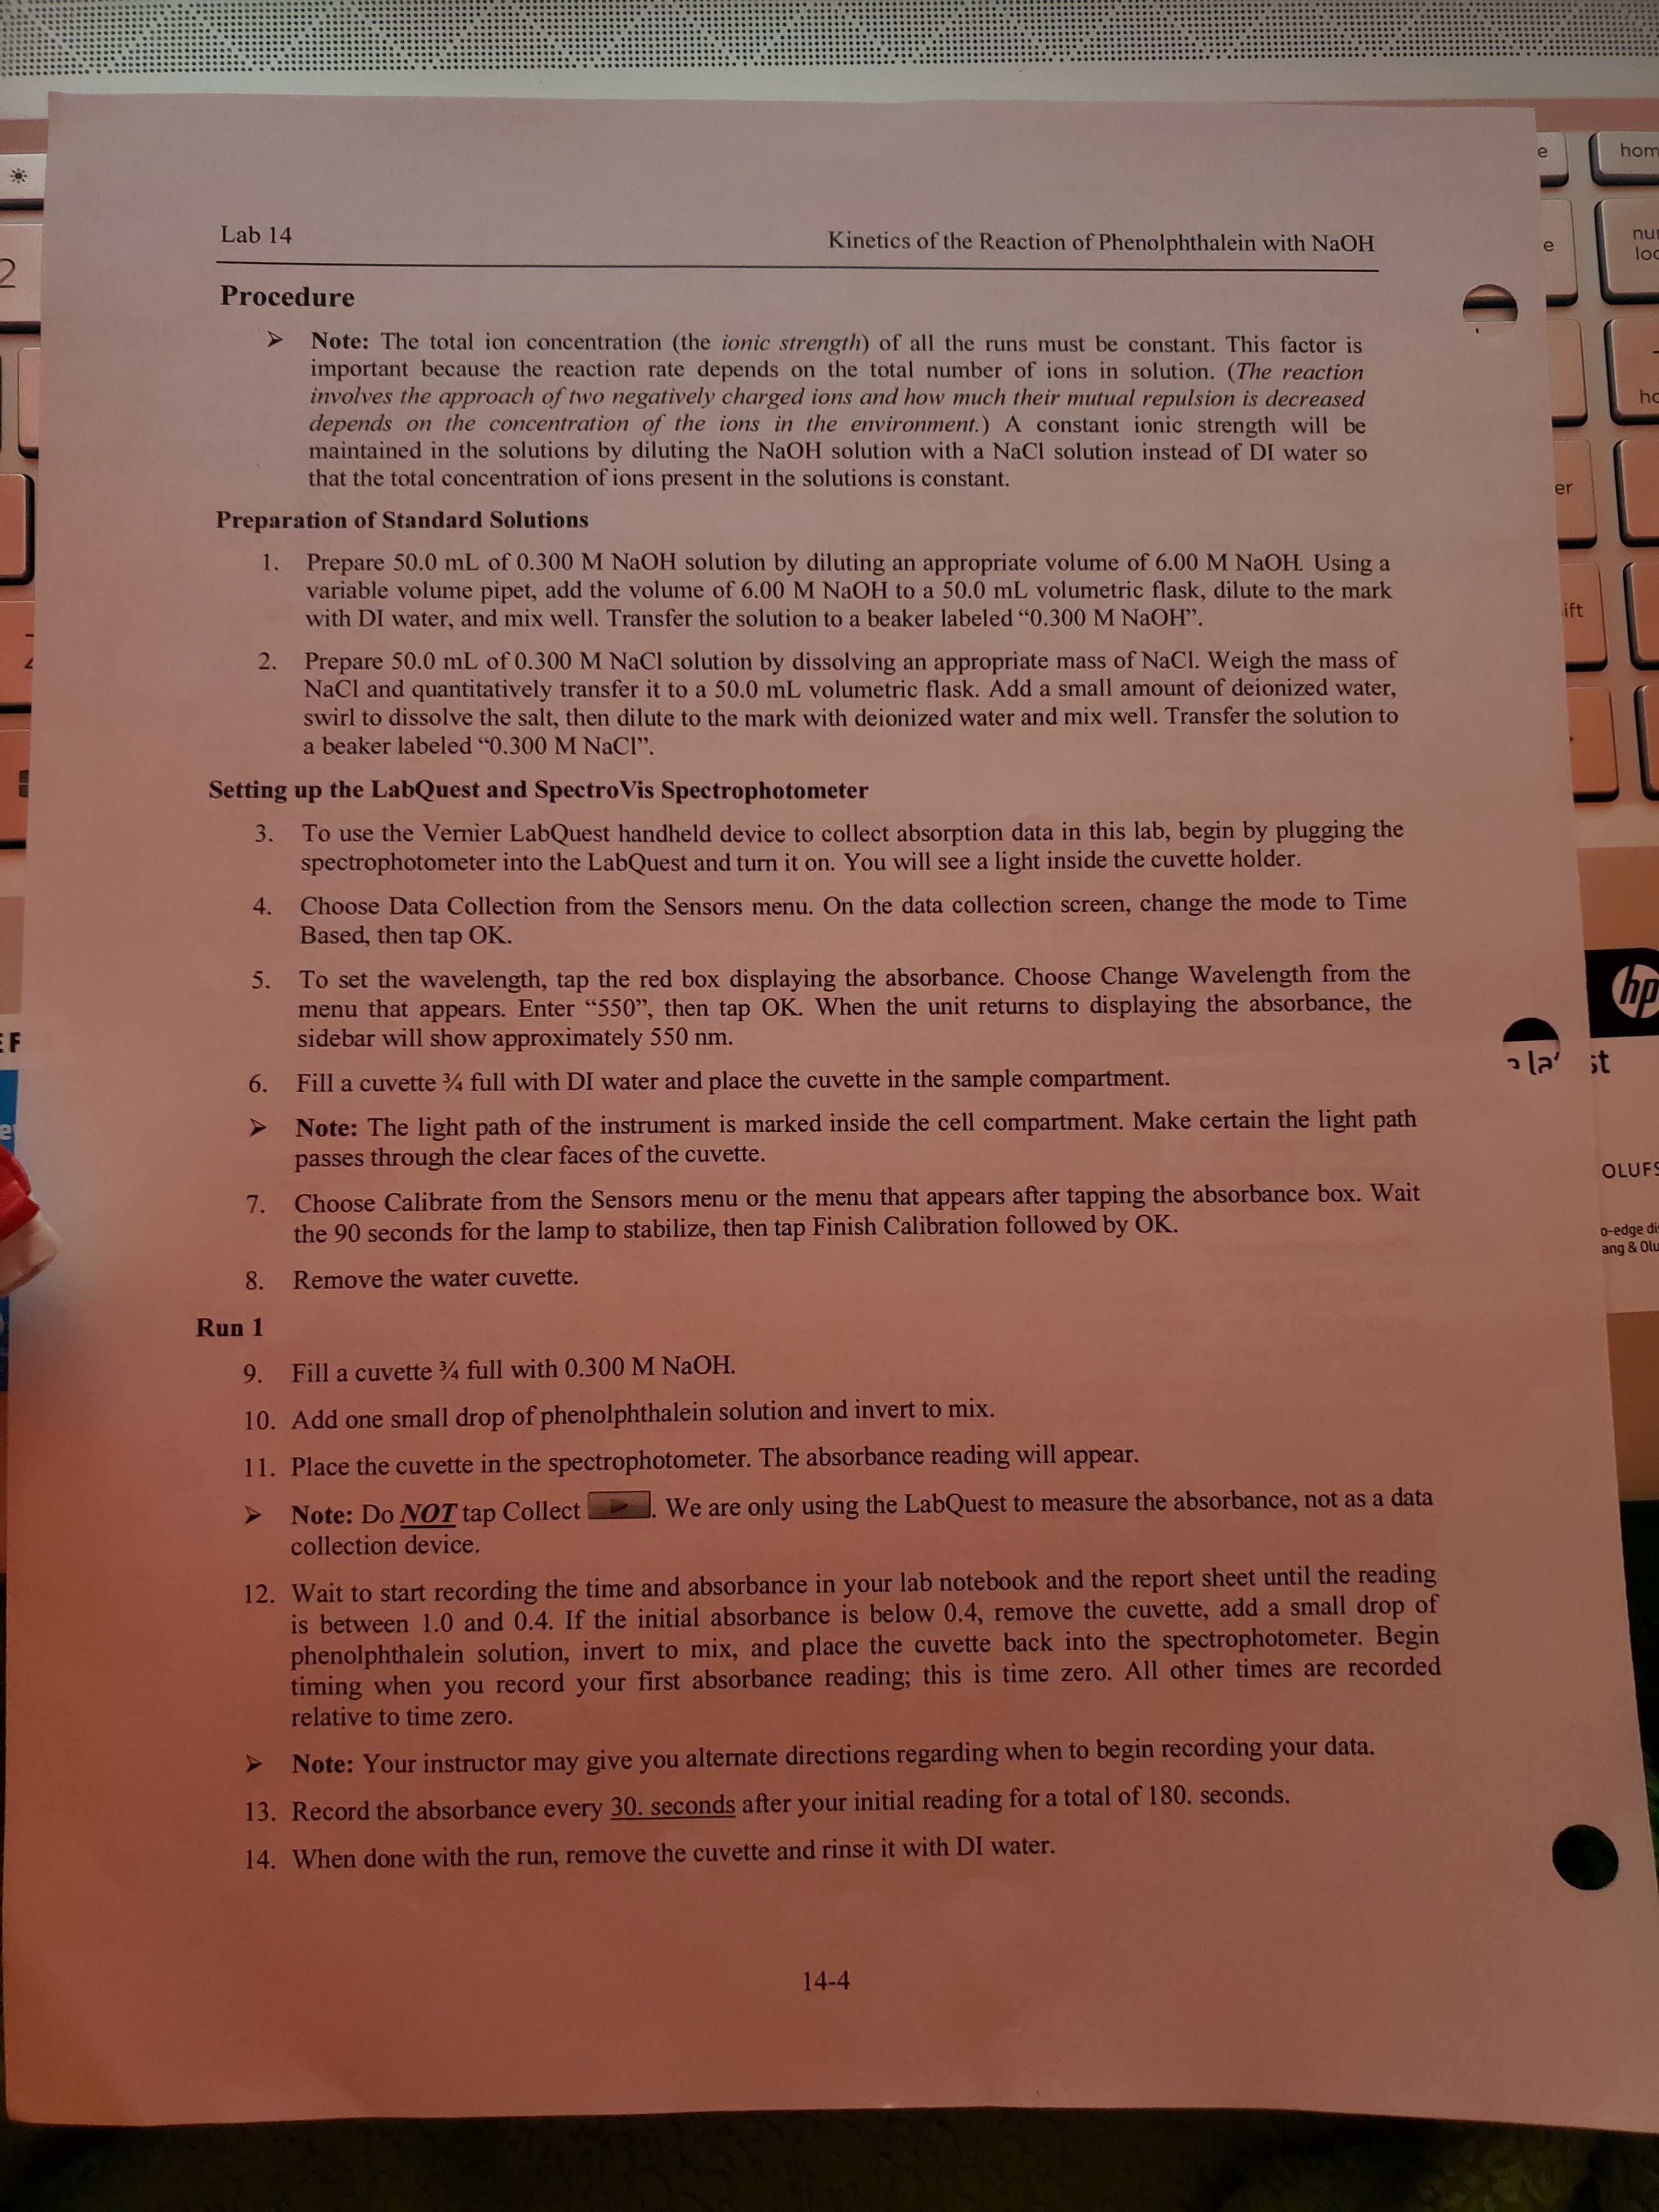
Lab 14
Kinetics of the Reaction of Phenolphthalein with NaOH
nur
loc
Procedure
Note: The total ion concentration (the ionic strength) of all the runs must be constant. This factor is
important because the reaction rate depends on the total number of ions in solution. (The reaction
involves the approach of two negatively charged ions and how much their mutual repulsion is decreased
depends on the concentration of the ions in the environment.) A constant ionic strength will be
maintained in the solutions by diluting the NAOH solution with a NaCl solution instead of DI water so
that the total concentration of ions present in the solutions is constant.
hc
er
Preparation of Standard Solutions
1. Prepare 50.0 mL of 0.300 M NAOH solution by diluting an appropriate volume of 6.00 M NAOH Using a
variable volume pipet, add the volume of 6.00 M NaOH to a 50.0 mL volumetric flask, dilute to the mark
with DI water, and mix well. Transfer the solution to a beaker labeled "0.300 M NAOH'".
ift
Prepare 50.0 mL of 0.300 M NaCl solution by dissolving an appropriate mass of NaCl. Weigh the mass of
NaCl and quantitatively transfer it to a 50.0 mL volumetric flask. Add a small amount of deionized water,
swirl to dissolve the salt, then dilute to the mark with deionized water and mix well. Transfer the solution to
2.
a beaker labeled "0.300 M NaCl".
Setting up the LabQuest and SpectroVis Spectrophotometer
3. To use the Vernier LabQuest handheld device to collect absorption data in this lab, begin by plugging the
spectrophotometer into the LabQuest and turn it on. You will see a light inside the cuvette holder.
4. Choose Data Collection from the Sensors menu. On the data collection screen, change the mode to Time
Based, then tap OK.
5. To set the wavelength, tap the red box displaying the absorbance. Choose Change Wavelength from the
menu that appears. Enter "550", then tap OK. When the unit returns to displaying the absorbance, the
sidebar will show approximately 550 nm.
hp
EF
a la' it
6. Fill a cuvette 4 full with DI water and place the cuvette in the sample compartment.
Note: The light path of the instrument is marked inside the cell compartment. Make certain the light path
passes through the clear faces of the cuvette.
OLUFS
7. Choose Calibrate from the Sensors menu or the menu that appears after tapping the absorbance box. Wait
the 90 seconds for the lamp to stabilize, then tap Finish Calibration followed by OK.
0-edge dis
ang & Olu
8. Remove the water cuvette.
Run 1
9. Fill a cuvette 4 full with 0.300 M NaOH.
10. Add one small drop of phenolphthalein solution and invert to mix.
11. Place the cuvette in the spectrophotometer. The absorbance reading will appear.
We are only using the LabQuest to measure the absorbance, not as a data
Note: Do NOT tap Collect
collection device.
12. Wait to start recording the time and absorbance in your lab notebook and the report sheet until the reading
is between 1.0 and 0.4. If the initial absorbance is below 0.4, remove the cuvette, add a small drop of
phenolphthalein solution, invert to mix, and place the cuvette back into the spectrophotometer. Begin
timing when you record your first absorbance reading; this is time zero. All other times are recorded
relative to time zero.
Note: Your instructor may give you alternate directions regarding when to begin recording your data.
13. Record the absorbance every 30. seconds after your initial reading for a total of 180. seconds.
14. When done with the run, remove the cuvette and rinse it with DI water.
144
![Lab 14
Run 2
Kinetics of the Reaction of Phenolphthalein with NaOH
15. Pipet 20.0 mL of 0.300 M NaOH solution into a small beaker and pipet 10.0 mL of 0.300 M Nach o ta
Mix the solution well.
16. Repeat Steps 9-14 using the resulting solution from Step 15 in place of the 0.300 M NAOH solution and
recording the absorbance every 60. seconds for a total of 360. seconds.
Run 3
Note: Reaction rates are a function of temperature. It is important that the solutions do not change
temperature during the course of the reaction. The cuvettes containing the two lower concentrations of
hydroxide ion (Runs 3 and 4) should be removed from the spectrophotometer's light path between readings
to prevent the solutions from warming.
17. Pipet 10.0 mL of the solution created for Run 2 into a small beaker and pipet 10.0 mL of 0.300 M NaCI
into it. Mix the solution well.
18. Repeat Steps 9-14 using the resulting solution from Step 17 in place of the 0.300 M NAOH solution and
recording the absorbance every 120. seconds for a total of 720. seconds.
Run 4
19. Pipet 10.0 mL of the solution created for Run 3 into a small beaker and pipet 10.0 mL of 0.300 M NaCi
into it. Mix the solution well.
20. Repeat Steps 9-14 using the resulting solution from Step 19 in place of the 0.300 M NAOH solution and
recording the absorbance every 120. seconds for a total of 720. seconds.
Data Analysis
Prepare the following graphs (six in total) as an x-y scatter plot using Excel or another spreadsheet software (see
Appendix II). All graphs must be appropriately labeled.
For Run 1, prepare two separate graphs, one of In(A) vs. time, the other of 1/A vs. time. Compare how
linear the two graphs are. If the reaction is first-order with respect to phenolphthalein, the graph of In(A) vs.
time will be linear. If the reaction is second-order with respect to phenolphthalein, the graph of 1/A vs. time
will be linear.
For each of Runs 2-4, prepare a graph of In(A) vs. time.
For each of the four graphs of In(A) vs. time, find the slope of the trendline and calculate k1. (Recall that
ki =-slope.) Determine the concentration of OH used for each of the four runs by considering how the
NaOH solution was diluted for each run. (Hint: MIV1 = M2V2.) Prepare a graph of ki vs. [OH]]. If the graph
is linear, the reaction is first-order with respect to [OH].
%3D
The slope of the line for the graph of ki vs. [OH¯]is equal to the overall rate constant, k. Determine k for the reaction
(including units) and report the overall rate law for the reaction.
For Your Consideration
How does the process of preparing an aqueous solution of known concentration from a stock solution differ
from preparing one from pure solid solute?
Would the concentration of OH in the solutions used for Runs 2-4 be different if deionized water was used
to prepare them instead of aqueous NaCl solution?
Why is an aqueous solution of NaCl used to prepare the solutions for Runs 2-4 instead of deionized water?
How might you experimentally distinguish between a first-order and second-order kinetic reaction?
14-5](/v2/_next/image?url=https%3A%2F%2Fcontent.bartleby.com%2Fqna-images%2Fquestion%2F42d3d97a-8dc1-4a4e-8b86-ef362a56017a%2F45fb91b6-a22b-468e-8deb-e06ff95dfde4%2Fp9fw7ec.jpeg&w=3840&q=75)
Transcribed Image Text:Lab 14
Run 2
Kinetics of the Reaction of Phenolphthalein with NaOH
15. Pipet 20.0 mL of 0.300 M NaOH solution into a small beaker and pipet 10.0 mL of 0.300 M Nach o ta
Mix the solution well.
16. Repeat Steps 9-14 using the resulting solution from Step 15 in place of the 0.300 M NAOH solution and
recording the absorbance every 60. seconds for a total of 360. seconds.
Run 3
Note: Reaction rates are a function of temperature. It is important that the solutions do not change
temperature during the course of the reaction. The cuvettes containing the two lower concentrations of
hydroxide ion (Runs 3 and 4) should be removed from the spectrophotometer's light path between readings
to prevent the solutions from warming.
17. Pipet 10.0 mL of the solution created for Run 2 into a small beaker and pipet 10.0 mL of 0.300 M NaCI
into it. Mix the solution well.
18. Repeat Steps 9-14 using the resulting solution from Step 17 in place of the 0.300 M NAOH solution and
recording the absorbance every 120. seconds for a total of 720. seconds.
Run 4
19. Pipet 10.0 mL of the solution created for Run 3 into a small beaker and pipet 10.0 mL of 0.300 M NaCi
into it. Mix the solution well.
20. Repeat Steps 9-14 using the resulting solution from Step 19 in place of the 0.300 M NAOH solution and
recording the absorbance every 120. seconds for a total of 720. seconds.
Data Analysis
Prepare the following graphs (six in total) as an x-y scatter plot using Excel or another spreadsheet software (see
Appendix II). All graphs must be appropriately labeled.
For Run 1, prepare two separate graphs, one of In(A) vs. time, the other of 1/A vs. time. Compare how
linear the two graphs are. If the reaction is first-order with respect to phenolphthalein, the graph of In(A) vs.
time will be linear. If the reaction is second-order with respect to phenolphthalein, the graph of 1/A vs. time
will be linear.
For each of Runs 2-4, prepare a graph of In(A) vs. time.
For each of the four graphs of In(A) vs. time, find the slope of the trendline and calculate k1. (Recall that
ki =-slope.) Determine the concentration of OH used for each of the four runs by considering how the
NaOH solution was diluted for each run. (Hint: MIV1 = M2V2.) Prepare a graph of ki vs. [OH]]. If the graph
is linear, the reaction is first-order with respect to [OH].
%3D
The slope of the line for the graph of ki vs. [OH¯]is equal to the overall rate constant, k. Determine k for the reaction
(including units) and report the overall rate law for the reaction.
For Your Consideration
How does the process of preparing an aqueous solution of known concentration from a stock solution differ
from preparing one from pure solid solute?
Would the concentration of OH in the solutions used for Runs 2-4 be different if deionized water was used
to prepare them instead of aqueous NaCl solution?
Why is an aqueous solution of NaCl used to prepare the solutions for Runs 2-4 instead of deionized water?
How might you experimentally distinguish between a first-order and second-order kinetic reaction?
14-5
Expert Solution
This question has been solved!
Explore an expertly crafted, step-by-step solution for a thorough understanding of key concepts.

This is a popular solution!

Trending now
This is a popular solution!

Step by step
Solved in 2 steps

Knowledge Booster


Learn more about
Need a deep-dive on the concept behind this application? Look no further. Learn more about this topic, chemistry and related others by exploring similar questions and additional content below.Recommended textbooks for you

Principles of Modern Chemistry
Chemistry
ISBN:
9781305079113
Author:
David W. Oxtoby, H. Pat Gillis, Laurie J. Butler
Publisher:
Cengage Learning

Chemistry: The Molecular Science
Chemistry
ISBN:
9781285199047
Author:
John W. Moore, Conrad L. Stanitski
Publisher:
Cengage Learning
Principles of Modern Chemistry
Chemistry
ISBN:
9781305079113
Author:
David W. Oxtoby, H. Pat Gillis, Laurie J. Butler
Publisher:
Cengage Learning
Chemistry: The Molecular Science
Chemistry
ISBN:
9781285199047
Author:
John W. Moore, Conrad L. Stanitski
Publisher:
Cengage Learning


Organic Chemistry
Chemistry
ISBN:
9781305580350
Author:
William H. Brown, Brent L. Iverson, Eric Anslyn, Christopher S. Foote
Publisher:
Cengage Learning

Physical Chemistry
Chemistry
ISBN:
9781133958437
Author:
Ball, David W. (david Warren), BAER, Tomas
Publisher:
Wadsworth Cengage Learning,