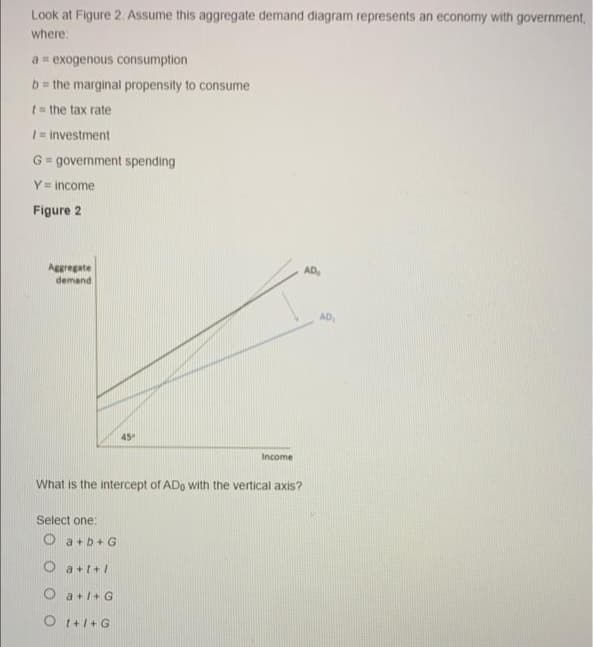
Look at Figure 2. Assume this aggregate demand diagram represents an economy with government, where: a = exogenous consumption b= the marginal propensity to consume t= the tax rate 1= investment G = government spending Y= income Figure 2 Aggregate demand AD, AD, 45 Income What is the intercept of ADo with the vertical axis?


Q: List pros and cons of government spending. Can government spending be shown on the IS model or the…
A: AD(aggregate demand) has the following components: AD=C+I+G+(X-M)C is consumption expenditureI is…
Q: • Assuming that there is no government spending or trade, an economy's GDP is the sum of domestic…
A: a. Aggregate demand is the sum of consumption and investment, so it is true. b. c0 is autonomous…
Q: Consider a hypothetical economy in which households spend $0.50 of each additional dollar they earn…
A: Given, Household spending = $0.50 each additional dollar Household save = $0.50 each additional…
Q: The diagram above shows the aggregate demand (AD), short-run aggregate supply (SRAS), and long-run…
A: An increase in income tax rates will reduce the disposable income, therefore, the aggregate demand…
Q: structions: Enter your answers as a whole number. How much does aggregate demand need to change to…
A:
Q: Please answer question 4 1.Draw Aggregate Demand, Short Run Aggregate Supply, and Long Run…
A: Meaning of Aggregate Demand and Aggregate Supply: The term aggregate demand refers to the…
Q: Assuming that there is no government spending or trade, an economy’s GDP is the sum of domestic…
A: In the case of a closed economy, where there is no government. The consumption function is given by…
Q: Consider a hypothetical economy in which households spend $0.50 of each additional dollar they earn…
A: Given The hypothetical economy in which households spend $0.50 of each additional dollar they earn…
Q: real GDP Q Figure C Figure D P level 60 P level 60 ASo LRAS LRAS 50 50 ASo 40 40 30 30 20 20 AD1 10…
A: In an economy, the concept of self-correction system of the market is given by the classical…
Q: Consider a hypothetical economy in which households spend $0.75 of each additional dollar they earn…
A: In financial matters, a cash multiplier is one of different firmly related proportions of business…
Q: Instructions: Enter your answer as a whole number. If you are entering a negative number include a…
A: PLEASE FIND THE ANSWER BELOW.
Q: True or False, the aggregate supply curve is a probably thought of as a price/output response curve
A: Aggregate supply refers to the total value of goods and services available for purchase at a…
Q: Instructions: Enter your answer as a whole number. If you are entering a negative number include a…
A: AD has to increase by (480 - 400) = $80 billion.
Q: Determine the effect of the following events would on the aggregate demand (AD) curve whether…
A: After a budget surplus, Congress moves to cut personal income taxes. This will shift AD to the right…
Q: Consider a hypothetical economy in vihich households spend $0.50 of each additional dollar they earn…
A: Multiplier = 1/(1-MPC)= 1/(1-0.5)=2 Increase in Government purchases= $3.5 billion Change in AD=…
Q: Suppose the aggregate demand (AD) and short-run aggregate supply (AS) schedules for an economy whose…
A: Equilbrium occurs at the intersection point of AD and AS. An increase in aggregate demand shifts…
Q: Consider a hypothetical economy in which households spend $0.75 of each additional dollar they earn…
A: Answer: Given, MPC (marginal propensity to consume) = 0.75 MPS (marginal propensity to save) = 0.25…
Q: The following graph shows the aggregate demand (AD) and aggregate supply (AS) curves for the United…
A: Aggregate Demand has four componenets. Namely, 1.Consumption 2.Investment 3.Government Spending…
Q: graph shows the economy's initial aggregate-demand curve (AD₁). Suppose the government increases its…
A: Aggregate demand is the sum of consumption expenditure, investment expenditure, government…
Q: MS AD, MD2 AD3 AD1 70. Please see graphs above. Suppose the multiplier is 5 and the government…
A: Multiplier effect of government expenditure: Multiplier = ∆Income∆Government expenditure…
Q: Assuming that there is no government spending or trade, an economy's GDP is the sum of domestic…
A: Gross Domestic Product (GDP) is the value at the current market prices of all FINAL goods and…
Q: Look at Figure 2. Assume this aggregate demand diagram represents an economy with government, where:…
A: The given model depicts a situation of a closed economy. AD=C+I+G AD function is the sum of…
Q: The following graph shows an aggregate demand curve (AD) illustrating the inverse relationship…
A: The contradictory phase in economy a situation happens when there is deflation or fall in prices of…
Q: symbol) on the following graph to show the aggregate demand curve (AD₂) after the multiplier effect…
A: In macroeconomics, a multiplier is a component of proportionality that actions how much an…
Q: Consider a demand-determined model, with a marginal propensity to consume of 0.80, a marginal…
A: Aggregate demand refers to the total purchase during the year . It is the sum of consumption ,…
Q: 6. Macroeconomic equilibrium and the ranges of the aggregate supply curve The following graph shows…
A: Aggregate Demand curve is the curve that represents or denote the sum of demands that an economy…
Q: The following graph depicts a macro equilibrium. Answer the questions based on the information in…
A: Answer d) Multiplier = 4GDP Gap = $400 (From Part c) Additional Investment can be calculated as…
Q: Instructions: Enter your answer as a whole number. If you are entering a negative number include a…
A: Aggregate demand refers to the cumulative spending on goods and services produced in the domestic…
Q: Assuming the economy is in an initial equilibrium at X, identify where the new equilibrium will be…
A: Note: Since we only answer up to 3 sub-parts, we’ll answer the first 3. Please resubmit the question…
Q: • Assuming that there is no government spending or trade, an economy's GDP is the sum of domestic…
A: Answer -
Q: The following graph shows the aggregate demand curve ( AD1) for this economy before the change in…
A:
Q: Consider a hypothetical economy in which households spend $0.50 of each additional dollar they earn…
A: MPC = 0.5 MPS 0.5 If the government increase its purchases (G) by the $3.5 million, the output (Y)…
Q: Assume that the diagram that follows depicts aggregate supply and demand conditions in an economy.…
A: (a) Equilibrium level of output is the one where the Aggregate Demand (AD) is equal to the Aggregate…
Q: a. How much does aggregate demand need to increase to restore the economy to its long-run…
A: Required increase in AD = Potential GDP - real GDP = (500 - 400) billion = $100 billion
Q: PAE = 600 + 0.5Y PAE = 400 + 0.5Y PAE = 200 + 0.5Y 600 400 200 45 400 800 1,200 Output, Y a.) Based…
A: In the given graph, three planned aggregate expenditure curves ar given with different autonomous…
Q: Look at Figure 3. Assume this aggregate demand diagram represents an economy with government, where:…
A: Aggregate demand = consumption spending + investment spending + government spending + net exports.
Q: What is the best approach to managing the economy, supply-side or demand-side economics? There are…
A: Recession: A recession is a macroeconomic term that alludes to a critical decrease in everyday…
Q: • Assuming that there is no government spending or trade, an economy's GDP is the sum of domestic…
A: Answer -
Q: Consider a hypothetical economy in which households spend $0.80 of each additional dollar they earn…
A: Expenditure multiplier (M) is the ratio between the change in the real GDP & the change in the…
Q: Evaluate the following statements using relevant diagrams and provide detailed explanations. The…
A: Hi! Thank you for the question As per the honor code, We’ll answer the first question since the…
Q: Suppose a market is made up of five consumers, each with identical individual demand given as P =…
A: Answer: Aggregate demand curve: aggregate demand curve is the horizontal summation of individual…
Q: Construct an Aggregate Supply and Aggregate Demand model where AS and AD are in equilibrium at…
A: Below graph shows the GDP at potential level of 13 Trillion$ Recession in the economy, results in…
Q: Suppose that the aggregate demand and aggregate supply schedules for a hypothetical economy are as…
A: Aggregate Demand and Aggregate Supply The entire amount of money spent on those goods and services…
Q: Suppose that the aggregate demand and aggregate supply schedules for a hypothetical economy are as…
A: Real GDP demanded can be plotted against price level as shown below with price level on y-axis and…
Q: things equal, what effects would each of the following have on aggregate demand or aggregate supply?…
A: DISCLAIMER “Since you have asked multiple question, we will solve the first 3 subparts for you. If…
Do Answer ASAP.

Step by step
Solved in 2 steps


- please explain each question. 1. We assumeconstantMPC in our model. Is this assumption true in the real world? 2. What determines the proportion of bonds/money that the household keeps? 3. What effect an increase of government spending will have on the output equilibrium in the goods market? Explain using autonomous spending.Course: Macroeconomic - IS-LM Model Prove mathematically the following: Given an increase in the proportional tax on income(t), what happens to the level of output and to the tax?" . Hint: for demostration, use the IS general function for a closed economy Y = C + I + G, where C = a + c*YD and YD = Y + TR - Y*t (where t = proportional income tax) and realize changes i.e., from "t1" to "t2"Suppose that a local economy has the following values for Desired C, I, G, and NX at a price levelof 100 given by: C = 6,000 + 0.9(1 − t)YI = 3,100G = 900NX = 2,000 − 0.06YThe tax rate (t) is equal to 10%. For every $1 increase in the price level, AutonomousConsumption (C) and Autonomous Investment (I) each decrease by $1.It also has an aggregate supply (AS) given by: AS = 2p10. What is the Short-Run Real GDP in this economy? Show your work. 11. Is this economy running a primary budget surplus or a primary budget deficit? How largeis it (in dollars)? Show your work. Suppose also that this government has an outstanding debt of $10,000, owed with an interestrate of 1%.12. Is this economy running a total budget surplus or a total budget deficit? How large is it(in dollars)? What is this country’s debt-to-GDP ratio? Show your work. Suppose that the above questions (Q10 – Q11) is only for the year 2010. Assume thateverything is the same (Ceteris Paribus) in 2011 and 2012 as it was in…
- Please no written by hand solution Consider the following economic situations:C = $4.0 trillionI = $1.5 trillionG = $3.0 trillionT = $3.0 trillionNX = $1.0 trillionF = 0mpc = 0.8d = 0.35x = 0.15r = 1% λ = 0.5A. Calculate an expression for the IS, MP and AD curves ( r= ?, IS Y= ?, AD Y=?)B. Let AS curve be given by the relation: π = 6 + 1.5 (Y - 25.5) (i.e. the price shock is zero). What are the equilibrium values of inflation, output and the real interest rate(π, Y, r)?C. Suppose government purchases are raised from $3.0 trillion to $3.5 trillion. What are new short-run equilibrium inflation values, output and the real interest rate (π, Y, r}?D. Suppose a financial crisis begins, and ƒ increases ƒ = 3. (Assume government purchases are again as in part (a). What are the new short-run equilibrium values of inflation, output, and the interest rate (π, Y, r}?(Please solve all the parts with numerical steps so it could be practiced easily)Real GDP Real GDPDemanded, Price Level Supplied,Billions (Price Index) Billions$100 300 $450200 250 400300 200 300400 150 200500 100 100 Use these sets of data to graph the aggregate demandand aggregate supply curves. What is the equilibriumprice level and the equilibrium level of real output inthis hypothetical economy? Is the equilibrium real output also necessarily the full-employment real output?Explain.b. Why will a price level of 150 not be an equilibriumprice level in this economy? Why not 250?c. Suppose that buyers desire to purchase $200 billion ofextra real output at each price level. Sketch in the newaggregate demand curve as AD1. What factors mightcause this change in aggregate demand? What is thenew equilibrium price level and level of real output?Suppose we are in an economy with rich households and poor households. Rich and poor households have different consumption functions, with Cpoor = 100 + 35(Y poor − Tpoor) Crich = 100 + 15(Y rich − Trich) where Y rich, Y poor are the incomes of rich and poor households and T rich, T poor are the taxes faced by rich and poor households. We also have I = 200,G = 100, T = T poor + T rich = 100. Closing out the model, Y = C + I + G = Cpoor + Crich + I + G a Suppose that Y poor = Y rich Y2 (in other words, the total income of poor households is equal to total income of rich households.) Supposing further that T rich = T poor = 50, calculate equilibrium output Y . b Now suppose that Trich = 40,Tpoor = 60. What is equilibrium output now? c How can the government increase output without changing the deficit (hint: think about the difference between output in b and output in c.) d Now assume that T rich = 40, T poor = 60, but instead of output being split equally between rich and poor…
- Consider the following macroeconomy. All amounts are in millions (m.) of $: C = 750 + 0.8 YD I = 1200 G = 150 T = 250 Calculate eqm Y and prove that I=sum of S at this equilibrium. What is meant by the “Paradox of Thrift” (POT)? Go back to the original eqm of part a. Now prove using multiplier analysis that the POT holds in this economy by assuming that the change in co is -$50 m. As part of your answer, explain “intuitively” why this paradox exists. Show what happens in the Z-Y space graph.2. In macroeconomic theory, total or aggregate spending is denoted by A and total or aggregateproduction of income by Y. Which one of the following statements is incorrect? A When A is greater than Y, there is disequilibrium and Y will tend to increase.B When A is equal to Y, there is equilibrium and Y will remain unchanged.C When A is less than Y, there is disequilibrium and Y will decrease.D When A is greater than Y, there is disequilibrium and A will decrease.Suppose firms become optimistic about futurebusiness conditions and invest heavily in new capitalequipment.a. Draw an aggregate-demand/aggregate-supplydiagram to show the short-run effect of thisoptimism on the economy. Label the new levels ofprices and real output. Explain in words why theaggregate quantity of output supplied changes.b. Now use the diagram from part (a) to show thenew long-run equilibrium of the economy. (Fornow, assume there is no change in the long-runaggregate-supply curve.) Explain in words whythe aggregate quantity of output demanded changesbetween the short run and the long run.c. How might the investment boom affect thelong-run aggregate-supply curve? Explain.
- Please no written by hand solution Consider a scenario of a closed economy in the short run where price level is fixed. Assume that bothtaxes and money supply increase in a way that keep output constant in equilibrium (suppose that themarginal propensity to consume is less than one). Which of the following may result from the policychange?a) It will lead to an increase in investment but a decrease in consumption.b) It will result in an increase in investment but a decrease in government spending.c) It will lead to an increase in investment and private saving.d) It will decrease investment but increase in public saving.A. Assume that a hypothetical economy with an MPC of .75 is experiencing severe recession. By how much would government spending have to rise to shift the aggregate demand curve rightward by $70 billion? B. How large a tax cut would be needed to achieve the same increase in aggregate demand?Define the concept of equilibrium in the simple expenditure model we developed in class. Now, explain what signal in spending will tell us that the economy is not in equilibrium? Lastly, assume that we find that actual Y is greater than equilibrium Y, Ye thus actual current Y>Ye. Explain the reaction by firms to this situation and what you expect to happen to the actual level of Y because of this corporate reaction. Show the graph of the initial situation and the resulting change in Y due to the corporate reaction.

