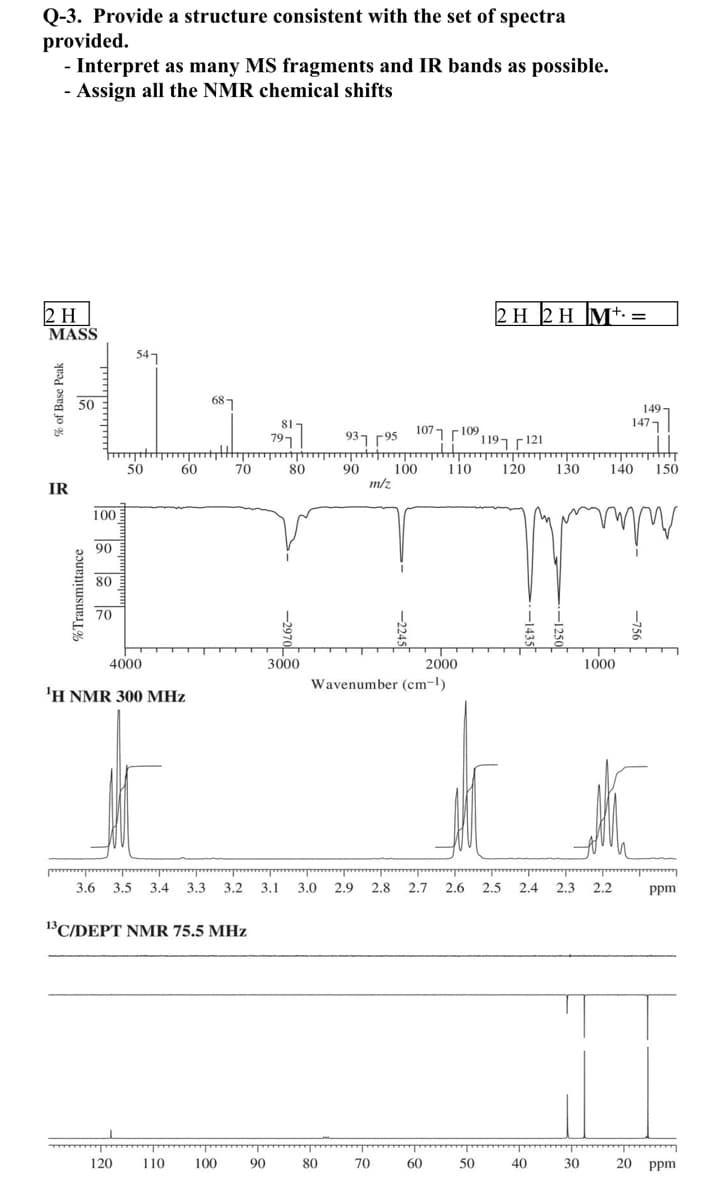
Q-3. Provide a structure consistent with the set of spectra provided. - Interpret as many MS fragments and IR bands as possible. - Assign all the NMR chemical shifts 2 H MASS 2 H 2 H M+. = 54 50 687 149- 1477 797 ,rio ו 2107ק ך93 121 F ך 119 50 60 70 80 90 100 m/z 110 120 130 140 150 IR 100 90 80 70 2000 Wavenumber (cm-l) 4000 3000 1000 'H NMR 300 MHz 3.6 3.5 3.4 3.3 3.2 3.1 3.0 2.9 2.8 2.7 2.6 2,5 2.4 2.3 2.2 ppm 13 C/DEPT NMR 75.5 MHz 120 110 100 90 80 70 60 50 40 30 20 ppm % of Base Peak %Transmittance


Analyzing Infrared Spectra
The electromagnetic radiation or frequency is classified into radio-waves, micro-waves, infrared, visible, ultraviolet, X-rays and gamma rays. The infrared spectra emission refers to the portion between the visible and the microwave areas of electromagnetic spectrum. This spectral area is usually divided into three parts, near infrared (14,290 – 4000 cm-1), mid infrared (4000 – 400 cm-1), and far infrared (700 – 200 cm-1), respectively. The number set is the number of the wave (cm-1).
IR Spectrum Of Cyclohexanone
It is the analysis of the structure of cyclohexaone using IR data interpretation.
IR Spectrum Of Anisole
Interpretation of anisole using IR spectrum obtained from IR analysis.
IR Spectroscopy
Infrared (IR) or vibrational spectroscopy is a method used for analyzing the particle's vibratory transformations. This is one of the very popular spectroscopic approaches employed by inorganic as well as organic laboratories because it is helpful in evaluating and distinguishing the frameworks of the molecules. The infra-red spectroscopy process or procedure is carried out using a tool called an infrared spectrometer to obtain an infrared spectral (or spectrophotometer).

Step by step
Solved in 2 steps with 2 images


