Results • Time Absorbance 30 °C Absorbance 37 °C Generation time Generation time t = 0 min at 30 °C at 37 °C 0.05 0.Q5 t 20 min 0.06 0.07 t = 40 min 0.1 0.16 0.21 0.44 t = 60 min %3D t = 80 min %3D 0.28 0.95 Complete the graph. Make sure this figure has a description and all other labels are included. Once you have completed graphing the points, draw a best-fit line for each of your data sets by eye. Questions: 1. Which data point can be the first to be considered in log phase for each line? (It will be the first point that seems to be described by your best-fit line.) For the 30° C culture the -minute point is the first one likely to be in log phase. For the 37° C culture the -minute point is the first one likely to be in log phase. Incubation Temperatures - Growth Bio 40 - Fall 2019 Page 6
Results • Time Absorbance 30 °C Absorbance 37 °C Generation time Generation time t = 0 min at 30 °C at 37 °C 0.05 0.Q5 t 20 min 0.06 0.07 t = 40 min 0.1 0.16 0.21 0.44 t = 60 min %3D t = 80 min %3D 0.28 0.95 Complete the graph. Make sure this figure has a description and all other labels are included. Once you have completed graphing the points, draw a best-fit line for each of your data sets by eye. Questions: 1. Which data point can be the first to be considered in log phase for each line? (It will be the first point that seems to be described by your best-fit line.) For the 30° C culture the -minute point is the first one likely to be in log phase. For the 37° C culture the -minute point is the first one likely to be in log phase. Incubation Temperatures - Growth Bio 40 - Fall 2019 Page 6

Chapter14: Formula Method
Section: Chapter Questions
Problem 33SST

Related questions

Question
Complete the graph in generation time and answer questions in no.1
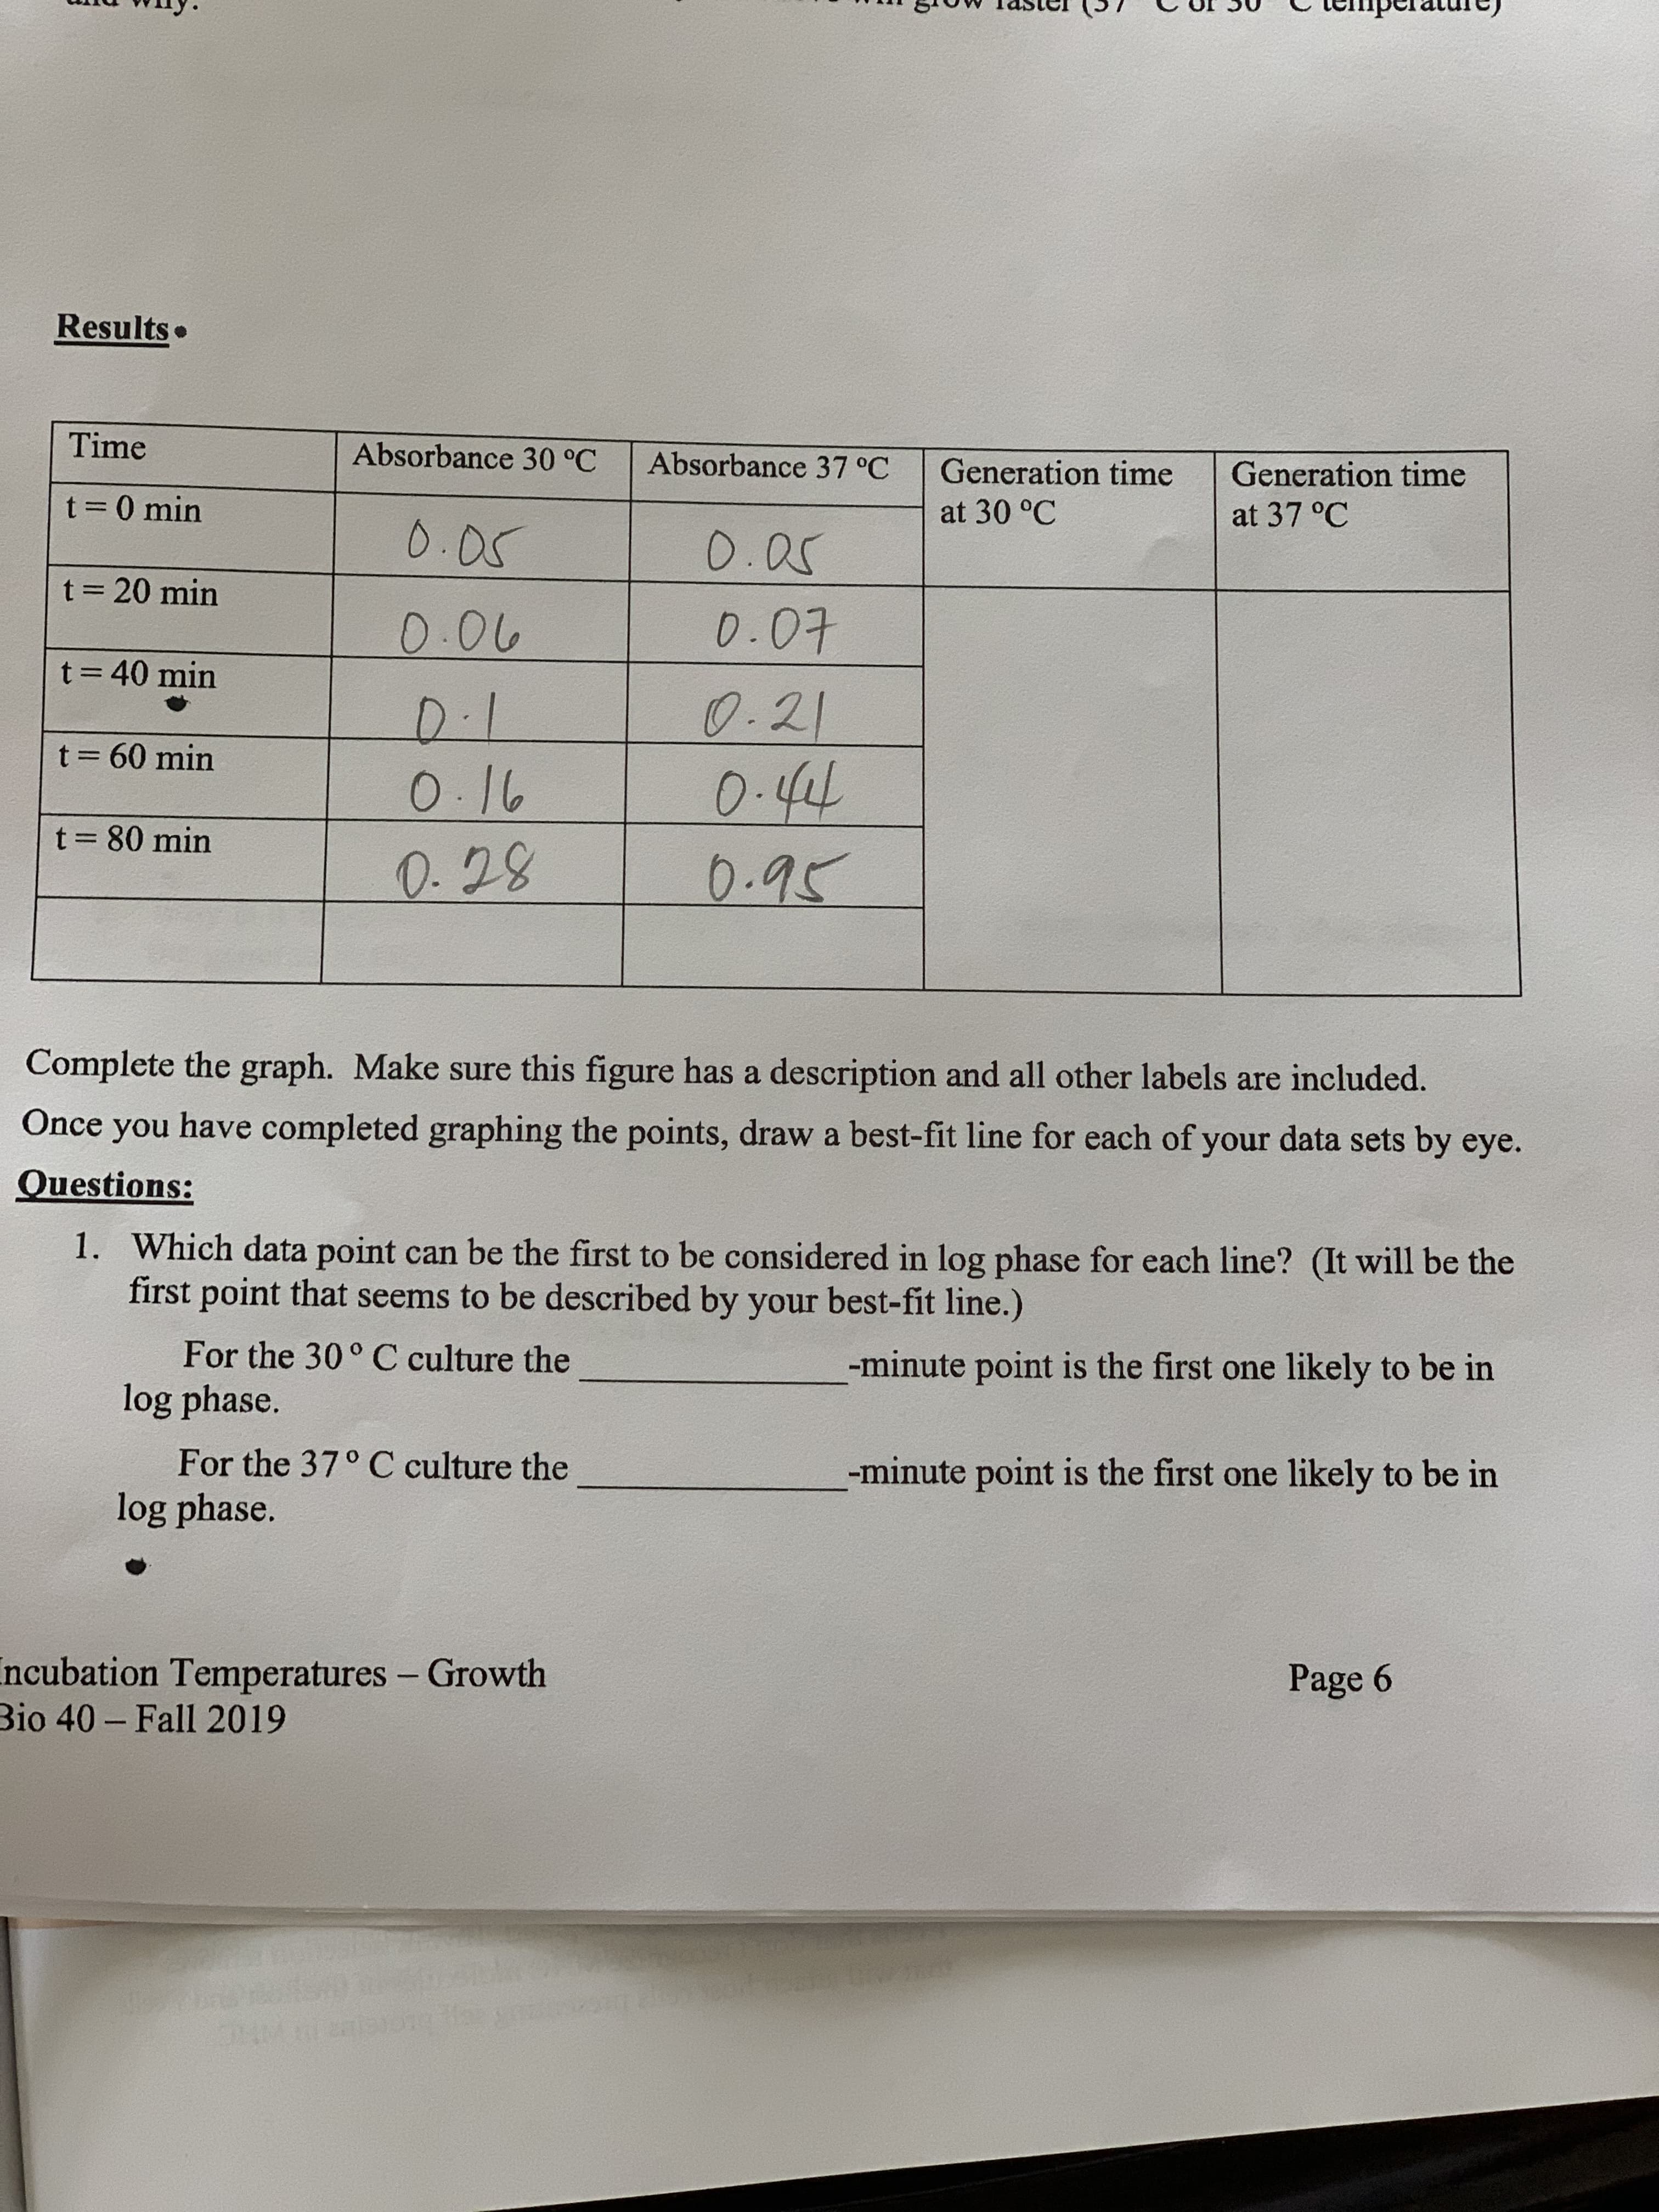
Transcribed Image Text:Results •
Time
Absorbance 30 °C
Absorbance 37 °C
Generation time
Generation time
t = 0 min
at 30 °C
at 37 °C
0.05
0.Q5
t 20 min
0.06
0.07
t = 40 min
0.1
0.16
0.21
0.44
t = 60 min
%3D
t = 80 min
%3D
0.28
0.95
Complete the graph. Make sure this figure has a description and all other labels are included.
Once you have completed graphing the points, draw a best-fit line for each of your data sets by eye.
Questions:
1. Which data point can be the first to be considered in log phase for each line? (It will be the
first point that seems to be described by your best-fit line.)
For the 30° C culture the
-minute point is the first one likely to be in
log phase.
For the 37° C culture the
-minute point is the first one likely to be in
log phase.
Incubation Temperatures - Growth
Bio 40 - Fall 2019
Page 6
Expert Solution
This question has been solved!
Explore an expertly crafted, step-by-step solution for a thorough understanding of key concepts.

Step by step
Solved in 2 steps with 5 images

Knowledge Booster


Learn more about
Need a deep-dive on the concept behind this application? Look no further. Learn more about this topic, biology and related others by exploring similar questions and additional content below.Recommended textbooks for you

Cardiopulmonary Anatomy & Physiology
Biology
ISBN:
9781337794909
Author:
Des Jardins, Terry.
Publisher:
Cengage Learning,

Biology: The Dynamic Science (MindTap Course List)
Biology
ISBN:
9781305389892
Author:
Peter J. Russell, Paul E. Hertz, Beverly McMillan
Publisher:
Cengage Learning
Cardiopulmonary Anatomy & Physiology
Biology
ISBN:
9781337794909
Author:
Des Jardins, Terry.
Publisher:
Cengage Learning,
Biology: The Dynamic Science (MindTap Course List)
Biology
ISBN:
9781305389892
Author:
Peter J. Russell, Paul E. Hertz, Beverly McMillan
Publisher:
Cengage Learning