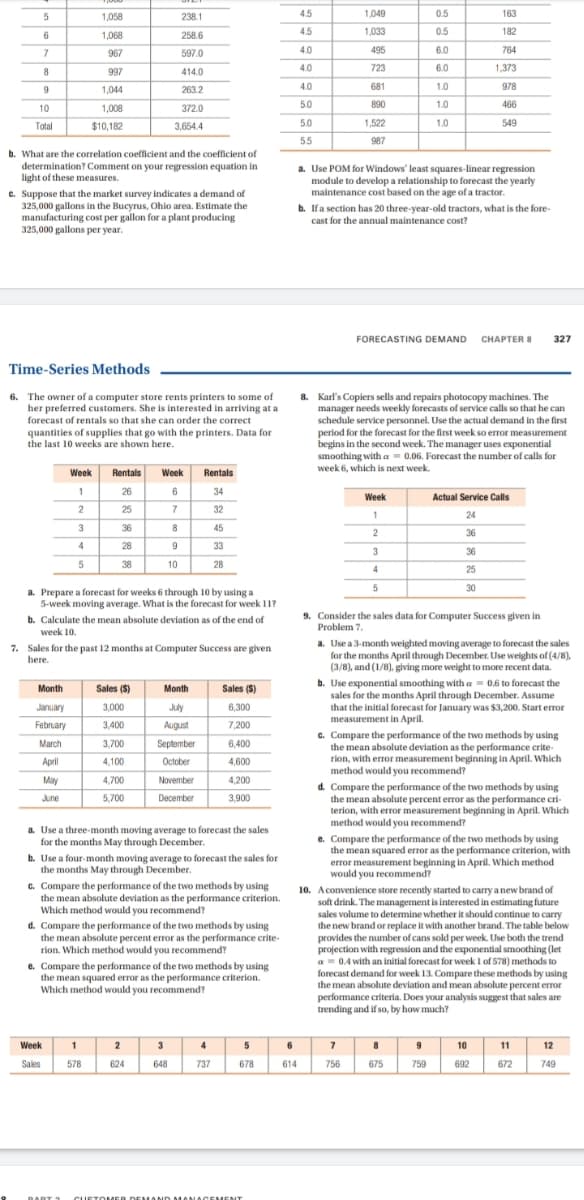
The owner of a computer store rents printers to some of her preferred customers. She is interested in arriving at a forecast of rentals so that she can order the correct quantities of supplies that go with the printers. Data for the last 10 weeks are shown here. Week Rentals Week Rentals 26 6 34 2 25 32 3 36 45 28 33 38 10 28 a. Prepare a forecast for weeks 6 through 10 by using a 5-week moving average. What is the forecast for week 11? b. Calculate the mean absolute deviation as of the end of week 10.
The owner of a computer store rents printers to some of her preferred customers. She is interested in arriving at a forecast of rentals so that she can order the correct quantities of supplies that go with the printers. Data for the last 10 weeks are shown here. Week Rentals Week Rentals 26 6 34 2 25 32 3 36 45 28 33 38 10 28 a. Prepare a forecast for weeks 6 through 10 by using a 5-week moving average. What is the forecast for week 11? b. Calculate the mean absolute deviation as of the end of week 10.

Practical Management Science
6th Edition
ISBN:9781337406659
Author:WINSTON, Wayne L.
Publisher:WINSTON, Wayne L.
Chapter11: Simulation Models
Section: Chapter Questions
Problem 52P

Related questions

Question
Transcribed Image Text:1,058
238.1
4.5
1,049
0.5
163
6.
1,068
258.6
4.5
1,033
0.5
182
967
597.0
4.0
495
6.0
764
4.0
723
6.0
1,373
8.
997
414.0
4.0
681
1.0
978
1,044
263.2
5.0
890
1.0
466
10
1,008
372.0
Total
$10,182
3,654.4
5.0
1,522
1.0
549
55
987
b. What are the correlation coefficient and the coefficient of
determination? Comment on your regression equation in
light of these measures.
a. Use POM for Windows' least squares-linear regression
module to develop a relationship to forecast the yearly
maintenance cost based on the age of a tractor.
c. Suppose that the market survey indicates a demand of
325,000 gallons in the Bucyrus, Ohio area. Estimate the
manufacturing cost per gallon for a plant producing
325,000 gallons per year.
b. Ifa section has 20 three-year-old tractors, what is the fore-
cast for the annual maintenance cost?
FORECASTING DEMAND CHAPTER 8
327
Time-Series Methods
8. Karl's Copiers sells and repairs photocopy machines. The
manager needs weekly forecasts of service calls so that he can
schedule service personnel. Use the actual demand in the first
period for the forecast for the first week so error measurement
begins in the second week. The manager uses exponential
smoothing witha = 0.06. Forecast the number of calls for
week 6, which is next week.
6.
The owner of a computer store rents printers to some of
her preferred customers. She is interested in arriving at a
forecast of rentals so that she can order the correct
quantities of supplies that go with the printers. Data for
the last 10 weeks are shown here.
Week
Rentals
Week
Rentals
1
26
34
Week
Actual Service Calls
2
25
7
32
1
24
3
36
45
2
36
4
28
33
36
5
38
10
28
4
25
30
a. Prepare a forecast for weeks 6 through 10 by using a
5-week moving average. What is the forecast for week 11?
b. Calculate the mean absolute deviation as of the end of
week 10.
9. Consider the sales data for Computer Success given in
Problem 7.
7. Sales for the past 12 months at Computer Success are given
here.
a. Use a 3-month weighted moving average to forecast the sales
for the months April through December. Use weights of (4/8),
(3/8), and (1/8), giving more weight to more recent data.
b. Use exponential smoothing with a = 0.6 to forecast the
sales for the months April through December. Assume
that the initial forecast for January was $3,200. Start error
measurement in April.
c. Compare the performance of the two methods by using
the mean absolute deviation as the performance crite-
rion, with error measurement beginning in April. Which
method would you recommend?
Month
Sales (S)
Month
Sales ($)
January
3,000
July
6,300
February
3,400
August
7,200
March
3,700
September
6,400
April
4,100
October
4,600
May
4,700
November
4,200
d. Compare the performance of the two methods by using
the mean absolute percent error as the performance cri-
terion, with error measurement beginning in April. Which
method would you recommend?
June
5,700
December
3,900
a. Use a three-month moving average to forecast the sales
for the months May through December.
e. Compare the performance of the two methods by using
the mean squared error as the performance criterion, with
error measurement beginning in April. Which method
would you recommend?
b. Use a four-month moving average to forecast the sales for
the months May through December.
c. Compare the performance of the two methods by using
the mean absolute deviation as the performance criterion.
Which method would you recommend?
10. A convenience store recently started to carry a new brand of
soft drink. The management is interested in estimating future
sales volume to determine whether it should continue to carry
the new brand or replace it with another brand. The table below
provides the number of cans sold per week. Use both the trend
projection with regression and the exponential smoothing (let
a = 0.4 with an initial forecast for week I of 578) methods to
forecast demand for week 13. Compare these methods by using
the mean absolute deviation and mean absolute percent error
performance criteria. Does your analysis suggest that sales are
trending and if so, by how much?
d. Compare the performance of the two methods by using
the mean absolute percent error as the performance crite-
rion. Which method would you recommend?
e. Compare the performance of the two methods by using
the mean squared error as the performance criterion.
Which method would you recommend?
2
Week
3
4
6
10
11
12
Sales
578
624
648
737
678
614
756
675
759
692
672
749
BART 1
CUST OMER DEMAN D MANLAGEMENT
Expert Solution
This question has been solved!
Explore an expertly crafted, step-by-step solution for a thorough understanding of key concepts.

This is a popular solution!

Trending now
This is a popular solution!

Step by step
Solved in 3 steps with 2 images

Knowledge Booster


Learn more about
Need a deep-dive on the concept behind this application? Look no further. Learn more about this topic, operations-management and related others by exploring similar questions and additional content below.Recommended textbooks for you
Practical Management Science
Operations Management
ISBN:
9781337406659
Author:
WINSTON, Wayne L.
Publisher:
Cengage,
Practical Management Science
Operations Management
ISBN:
9781337406659
Author:
WINSTON, Wayne L.
Publisher:
Cengage,