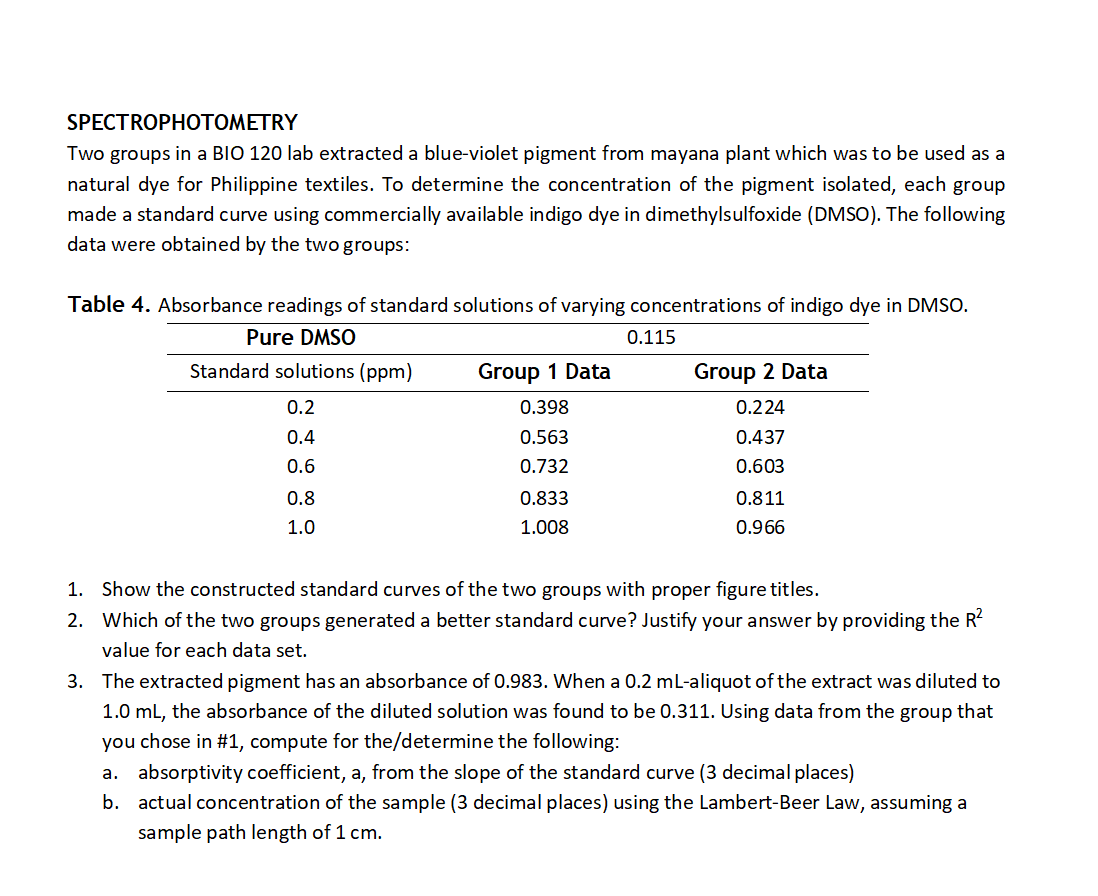
Two groups in a BIO 120 lab extracted a blue-violet pigment from mayana plant which was to be used as a natural dye for Philippine textiles. To determine the concentration of the pigment isolated, each group made a standard curve using commercially available indigo dye in dimethylsulfoxide (DMSO). The following data were obtained by the two groups: Table 4. Absorbance readings of standard solutions of varying concentrations of indigo dye in DMSO. Pure DMSO 0.115 Standard solutions (ppm) Group 1 Data Group 2 Data 0.2 0.398 0.224 0.4 0.563 0.437 0.6 0.732 0.603 0.8 0.833 0.811 1.0 1.008 0.966 1. Show the constructed standard curves of the two groups with proper figure titles. 2. Which of the two groups generated a better standard curve? Justify your answer by providing the R value for each data set. 3. The extracted pigment has an absorbance of 0.983. When a 0.2 mL-aliquot of the extract was diluted to 1.0 mL, the absorbance of the diluted solution was found to be 0.311. Using data from the group that you chose in #1, compute for the/determine the following: a. absorptivity coefficient, a, from the slope of the standard curve (3 decimal places) b. actual concentration of the sample (3 decimal places) using the Lambert-Beer Law, assuming a sample path length of 1 cm.
Two groups in a BIO 120 lab extracted a blue-violet pigment from mayana plant which was to be used as a natural dye for Philippine textiles. To determine the concentration of the pigment isolated, each group made a standard curve using commercially available indigo dye in dimethylsulfoxide (DMSO). The following data were obtained by the two groups: Table 4. Absorbance readings of standard solutions of varying concentrations of indigo dye in DMSO. Pure DMSO 0.115 Standard solutions (ppm) Group 1 Data Group 2 Data 0.2 0.398 0.224 0.4 0.563 0.437 0.6 0.732 0.603 0.8 0.833 0.811 1.0 1.008 0.966 1. Show the constructed standard curves of the two groups with proper figure titles. 2. Which of the two groups generated a better standard curve? Justify your answer by providing the R value for each data set. 3. The extracted pigment has an absorbance of 0.983. When a 0.2 mL-aliquot of the extract was diluted to 1.0 mL, the absorbance of the diluted solution was found to be 0.311. Using data from the group that you chose in #1, compute for the/determine the following: a. absorptivity coefficient, a, from the slope of the standard curve (3 decimal places) b. actual concentration of the sample (3 decimal places) using the Lambert-Beer Law, assuming a sample path length of 1 cm.

Principles of Instrumental Analysis
7th Edition
ISBN:9781305577213
Author:Douglas A. Skoog, F. James Holler, Stanley R. Crouch
Publisher:Douglas A. Skoog, F. James Holler, Stanley R. Crouch
Chapter1: Introduction
Section: Chapter Questions
Problem 1.11QAP

Related questions
Question
Transcribed Image Text:SPECTROPHOTOMETRY
Two groups in a BIO 120 lab extracted a blue-violet pigment from mayana plant which was to be used as a
natural dye for Philippine textiles. To determine the concentration of the pigment isolated, each group
made a standard curve using commercially available indigo dye in dimethylsulfoxide (DMSO). The following
data were obtained by the two groups:
Table 4. Absorbance readings of standard solutions of varying concentrations of indigo dye in DMSO.
Pure DMSO
0.115
Standard solutions (ppm)
Group 1 Data
Group 2 Data
0.2
0.398
0.224
0.4
0.563
0.437
0.6
0.732
0.603
0.8
0.833
0.811
1.0
1.008
0.966
1. Show the constructed standard curves of the two groups with proper figure titles.
2. Which of the two groups generated a better standard curve? Justify your answer by providing the R?
value for each data set.
3. The extracted pigment has an absorbance of 0.983. When a 0.2 mL-aliquot of the extract was diluted to
1.0 mL, the absorbance of the diluted solution was found to be 0.311. Using data from the group that
you chose in #1, compute for the/determine the following:
a. absorptivity coefficient, a, from the slope of the standard curve (3 decimal places)
b. actual concentration of the sample (3 decimal places) using the Lambert-Beer Law, assuming a
sample path length of 1 cm.
Expert Solution
This question has been solved!
Explore an expertly crafted, step-by-step solution for a thorough understanding of key concepts.

This is a popular solution!

Trending now
This is a popular solution!

Step by step
Solved in 4 steps with 2 images

Knowledge Booster


Learn more about
Need a deep-dive on the concept behind this application? Look no further. Learn more about this topic, chemistry and related others by exploring similar questions and additional content below.Recommended textbooks for you
Principles of Instrumental Analysis
Chemistry
ISBN:
9781305577213
Author:
Douglas A. Skoog, F. James Holler, Stanley R. Crouch
Publisher:
Cengage Learning
Principles of Instrumental Analysis
Chemistry
ISBN:
9781305577213
Author:
Douglas A. Skoog, F. James Holler, Stanley R. Crouch
Publisher:
Cengage Learning