
Related questions
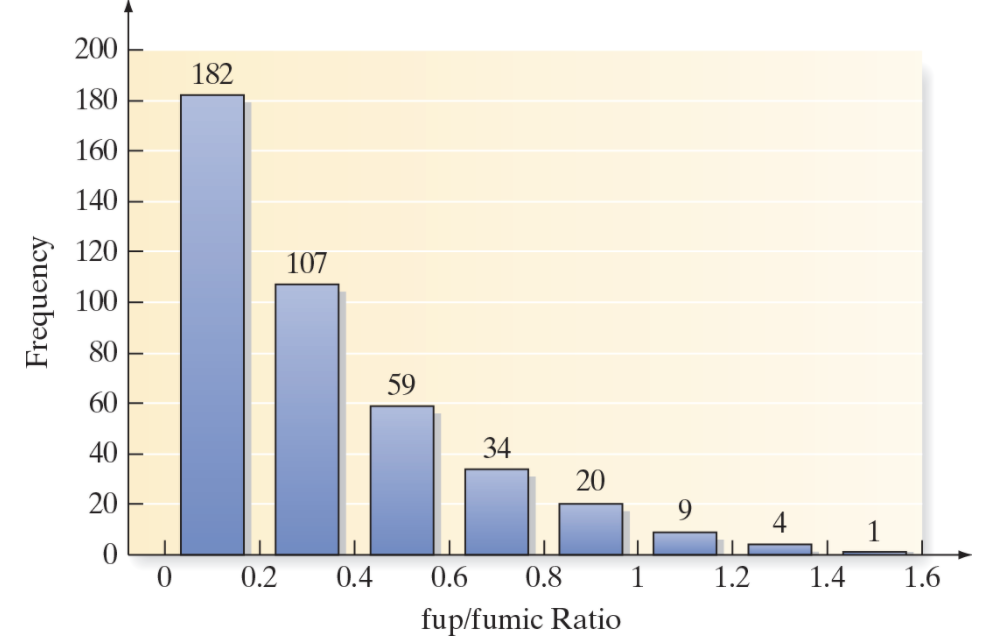
Testing the metabolic stability of compounds used in drugs is the cornerstone of new drug discovery. Two important values computed from the testing phase are the fraction of compound unbound to plasma (fup) and the fraction of compound unbound to microsomes (fumic). A key formula for assessing stability assumes that the fup/fumic ratio is 1. Pharmacologists at Pfizer Global Research and Development investigated this phenomenon and reported the results in ACS Medicinal Chemistry Letters (Vol. 1, 2010). The fup/fumic ratio was determined for each of 416 drugs in the Pfizer database. A graph describing the fup/fumic ratios is shown below.
-
What type of graph is displayed?
-
What is the quantitative variable summarized in the graph?
-
Determine the proportion of fup/fumic ratios that fall above 1.
-
Determine the proportion of fup/fumic ratios that fall below .4.


Trending nowThis is a popular solution!

Step by stepSolved in 5 steps


- Part darrow_forwardBased on the data of air pollution in Los Angeles in 2019, the Environmental Protection Agency (EPA) decided to publish a new stricter regulation effective in January 2020 to reduce hydrocarbon pollution. EPA wants to evaluate whether the new regulation makes significant differences in reducingpollution. EPA collects data of monthly hydrocarbon pollution level as follows: Jan Feb Mar Apr May Jun Jul Aug Sep Oct Nov Dec2019 7.3 6.0 5.4 5.9 3.9 5.7 6.9 7.6 6.3 5.8 5.1 5.92020 5.3 6.1 5.6 5.7 3.7 4.7 6.1 7.2 6.4 5.7 4.9 5.8 a. What statistical method can be applied for this study? Explain your answer b. What is the hypothesis of the study? c. At a 10% significance level, is the performance between the two sample groups significantly different?arrow_forwardFor each of the questions 1-4, answer the following (a-h are steps in a Hypothesis Test, see page 376 of your ebook). For steps f and g do both the p-value method and the critical value method: a) Claim in English: b) Claim in Symbolic Form: c) Null and Alternate Hypothesis: d) Significance Level: e) Test Statistic: f) Find Values: g) Make a Decision: h) Restate the Decision in Nontechnical Terms: i) If this is a statistically significant result, is it also a practically significant result?arrow_forward
- Research was conducted on the amount of oxygen runners could utilize during training, known as their VO2 max, and their finishing times for a 5K race to see if there was a significant relationship between these variables. The results for 8 runners were compiled and placed in the following table. VO2 Max (ml/kg/min) (x) 5K Finishing Time (min) (y) 16.28 34.66 20.55 37.41 18.62 34.11 15.78 37.36 18.12 37.56 39.49 23.7 26.88 28.72 43.39 20.69 Calculate the correlation coefficient. Round to three decimals. Find the equation of the regression line. Round each value to two decimals Preview Predict the time in the 5K for a runner whose VO, max is 30.12 ml/kg/min. Round your answer to two decimals Get Help: VIDEOarrow_forwardA screening test for a newly discovered disease is being evaluated. To determine the effectiveness of the new test, it was administered to 880 workers, and 120 of the individuals diagnosed with the disease tested positive. A negative test finding occurred in 50 people who had the disease. A total of 40 persons not diseased tested positive for it. Construct a 2 x 2 table similar to Table 12-1 and calculate the following: 1. Prevalence of the disease 2. Sensitivity 3. Specificity 4. Predictive value positive 5. Predictive value negative 6. Likelihood ratio positive 7. Likelihood ratio negative 8. Overall accuracy.arrow_forwardWhat is the predicted glia-neuron ratio for species with ln(brainmass) equal to that of humans (Homo sapiens)? Please put the answer in bold.arrow_forward
- An article reported data from a study in which both a baseline gasoline mixture and a reformulated gasoline were used. Consider the following observations on age (yr) and NOx emissions (g/kWh): Engine 1 2 3 4 5 6 7 8 9 10 Age 0 0 2 11 7 16 9 0 12 4 Baseline 1.70 4.38 4.06 1.24 5.29 0.59 3.35 3.45 0.73 1.22 Reformulated 1.86 5.91 5.51 2.70 6.50 0.71 4.95 4.86 0.72 1.41 Construct scatter plots of the baseline NOx emissions versus age. What appears to be the nature of the relationship between these two variables? There is no compelling relationship between the data. As age increases, emissions also increase. As age increases, emissions decrease.arrow_forwardPlease answer as many parts as possible. Also, the last answer I received was incorrect. Thank youarrow_forwardWrinkle recovery angle and tensile strength are the two most important characteristics for evaluating the performance of crosslinked cotton fabric. An increase in the degree of crosslinking, as determined by ester carboxyl band absorbance, improves the wrinkle resistance of the fabric (at the expense of reducing mechanical strength). The accompanying data on x = absorbance and y = wrinkle resistance angle was read from a graph in the paper "Predicting the Performance of Durable Press Finished Cotton Fabric with Infrared Spectroscopy".† x 0.115 0.126 0.183 0.246 0.282 0.344 0.355 0.452 0.491 0.554 0.651 y 334 342 355 363 365 372 381 392 400 412 420 Here is regression output from Minitab: Predictor Constant absorb S = 3.60498 Coef 321.878 156.711 SOURCE Regression Residual Error Total SE Coef 2.483 6.464 R-Sq = 98.5% DF 1 9 10 SS 7639.0 117.0 7756.0 T 129.64 24.24 0.000 0.000 R-Sq (adj) = 98.3% MS 7639.0 13.0 F P 587.81 (a) Does the simple linear regression model appear to be…arrow_forward
- Laetisaric acid is a compound that holds promise for control of fungus diseases in crop plants. The accompanying data show the results of growing the fungus Pythium (y) in various concentrations of laetisaric acid (x). Laetisaric acid concentration (uG/mL) Fungus growth (mm) 0. 33.3 31.0 29.8 27.8 6. 28.0 6. 29.0 10 25.5 10 23.8 20 18.3 20 15.5 30 11.7 30 10.0 Mean 11.500 23.642 Standard deviation 10.884 7.8471 T =-0.98754 %3D a. State the linear regression equation, and with a 0.01 level of significance, predict the amount (in mm) of fungus growth when 25 uG/mL laetisaric acid is applied. Assume the pairs of data follow a bivariate normal distribution and that the scatterplot shows no evidence of a non-linear relationship in the data. b. Determine the percentage of the variation in fungus growth that is explained by the linear relationship between laetisaric acid concentration and fungus growth. Attack Eilarrow_forwardIms.tu.edu.sa قائمة القراءة. Remaining Time: 34 minutes, 24 seconds. v Question Completion Status: QUESTION 1 "Suppose X has an exponential distribution with ß=1/2 , then P (X2 2) is " 0.3988 O 0.0183 0.4786 O 0.2916 QUESTION 2 "Suppose X has an exponential distribution with ß=1/4 , then P (Xs1.) is " O 0.9817 O 0.3246 O 0.4105 O 0.5116 QUESTION 3arrow_forwardChlorophylls a and b are plant pigments that absorb sunlight and transfer the energy into photosynthesis of carbohydrates from CO2 and H2O, releasing O2 in the process. Chlorophylls were extracted from chopped up grass and measured by spectrophotometry. The table shows results for chlorophyll a for four separate analysis of five blades of grass. Chlorophyll a (g/L) Blade 1 Blade 2 Blade 3 Blade 4 Blade 5 1.09 1.26 1.1 1.23 0.85 0.86 0.96 1.21 1.3 0.65 0.93 0.8 1.27 0.97 0.86 0.99 0.73 1.12 0.97 1.03 Four replicate measurements for each blade of grass tell us the precision of the analytical procedure (sanalysis). Differences between mean values for each of the five blades of grass are a measure of variation due to sampling (ssampling). Using Excel and it’s ANOVA function, find the standard deviations attributable to sampling and to analysis, as well as the overall standard deviation arising from both sources.arrow_forward
- MATLAB: An Introduction with ApplicationsStatisticsISBN:9781119256830Author:Amos GilatPublisher:John Wiley & Sons Inc
 Probability and Statistics for Engineering and th...StatisticsISBN:9781305251809Author:Jay L. DevorePublisher:Cengage Learning
 Statistics for The Behavioral Sciences (MindTap C...StatisticsISBN:9781305504912Author:Frederick J Gravetter, Larry B. WallnauPublisher:Cengage Learning
  Elementary Statistics: Picturing the World (7th E...StatisticsISBN:9780134683416Author:Ron Larson, Betsy FarberPublisher:PEARSON
 The Basic Practice of StatisticsStatisticsISBN:9781319042578Author:David S. Moore, William I. Notz, Michael A. FlignerPublisher:W. H. Freeman
 Introduction to the Practice of StatisticsStatisticsISBN:9781319013387Author:David S. Moore, George P. McCabe, Bruce A. CraigPublisher:W. H. Freeman