
Concept explainers
Videos
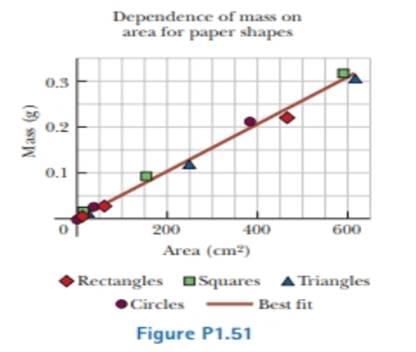
Review. A student is supplied with a stack of copy paper, ruler, compass, scissors, and a sensitive balance. He cuts out various shapes in various sizes, calculates their areas, measures their masses, and prepares the graph of Figure PI.51. (a) Consider the fourth experimental point from the top. How far is it from the best-lit straight line? Express your answer as a difference in vertical-axis coordinate, (b) Express your answer as a percentage, (c) Calculate the slope of the line, (d) State what the graph demonstrates, referring to the shape of the graph and the results of parts (b) and (c). (e) Describe whether this result should be expected theoretically, (f) Describe the physical meaning of the slope.
(a)
The distance of the fourth experimental point from the top from the best –fit straight line.
Answer to Problem 1.51P
The distance of the fourth experimental point from the top from the best fit straight line is
Explanation of Solution
Given data: The student is supplied with a stack of copy paper, ruler, compass, scissors, and a sensitive balance. A graph mass versus area is plotted for different sizes of the paper.
Consider the following figure.
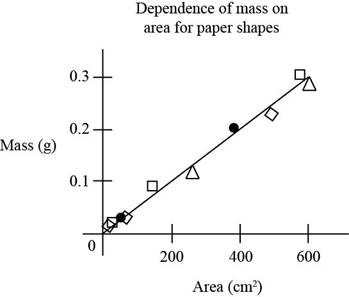
Figure (1)
Figure indicates the graph plotted area of pieces versus mass of the pieces of the paper.
The fourth experimental point from the top is a circle. It lies slightly above the best fit line.
From figure (1), the vertical coordinate for the forth experiment is
So the difference in the vertical axis coordinate is,
Here,
Substitute
Conclusion:
Therefore the distance of the fourth experimental point from the top from the best fit straight line is
(b)
The answer in the form of percentage.
Answer to Problem 1.51P
The answer in the form of percentage is
Explanation of Solution
Given data: The student is supplied with a stack of copy paper, ruler, compass, scissors, and a sensitive balance. A graph mass versus area is plotted for different sizes of the paper.
The expression for the percentage is,
Substitute
Conclusion:
Therefore the answer in the form of percentage is
(c)
The slope of the line.
Answer to Problem 1.51P
The slope of the line is
Explanation of Solution
Given data: The student is supplied with a stack of copy paper, ruler, compass, scissors, and a sensitive balance. A graph mass versus area is plotted for different sizes of the paper.
The expression for the slope is,
Here,
Substitute
Conclusion:
Therefore the slope of the line is
(d)
The demonstration from the graph referring to the shape of the graph and the results of part (b) and (c).
Answer to Problem 1.51P
The graph demonstrates that the mass of the cutout is proportional to its area for the shape cuts from this copy paper and the proportionality constant is
Explanation of Solution
Given data: The student is supplied with a stack of copy paper, ruler, compass, scissors, and a sensitive balance. A graph mass versus area is plotted for different sizes of the paper.
The graph given figure (1) demonstrates that the mass of the cutout in each shape is proportional to its area for the shape cuts from this copy paper and the proportionality constant is
The value of the slope from part (c) of the question and from the part (b) question the percentage uncertainty is
Conclusion:
Therefore the graph demonstrates that the mass of the cutout is proportional to its area for the shape cuts from this copy paper and the proportionality constant is
(e)
Whether this result should be expected theoretically or not.
Answer to Problem 1.51P
This result is to be expected theoretically if the paper has thickness and density that are uniform within the experimental uncertainty.
Explanation of Solution
Given data: The student is supplied with a stack of copy paper, ruler, compass, scissors, and a sensitive balance. A graph mass versus area is plotted for different sizes of the paper.
The graph given figure (1) demonstrates that the mass of the cutout in each shape is proportional to its area for the shape cuts from this copy paper and the proportionality constant is
The value of the slope from part (c) of the question is
Thus this result is expected theoretically when the object is having same aerial mass density and the paper has thickness and density that are uniform within the experimental uncertainty.
Conclusion:
Therefore this result is to be expected theoretically if the paper has thickness and density that are uniform within the experimental uncertainty.
(f)
The physical meaning of the slope.
Answer to Problem 1.51P
The physical meaning of the slope is the aerial density of the paper that represents the mass per unit area.
Explanation of Solution
Given data: The student is supplied with a stack of copy paper, ruler, compass, scissors, and a sensitive balance. A graph mass versus area is plotted for different sizes of the paper.
The graph given figure (1) demonstrates that the mass of the cutout in each shape is proportional to its area for the shape cuts from this copy paper and the proportionality constant is
The value of the slope from part (c) of the question is
The physical meaning of the slope is the aerial density of the paper that represent the mass per unit area.
Conclusion:
Therefore the physical meaning of the slope is the aerial density of the paper that represents the mass per unit area.
Want to see more full solutions like this?
Chapter 1 Solutions
EBK PHYSICS FOR SCIENTISTS AND ENGINEER
Additional Science Textbook Solutions
Glencoe Physical Science 2012 Student Edition (Glencoe Science) (McGraw-Hill Education)
Tutorials in Introductory Physics
Physical Science
College Physics (10th Edition)
The Cosmic Perspective Fundamentals (2nd Edition)
Conceptual Physics: The High School Physics Program


- Show that when A+B=C then A2+B2+2ABcos , where is the angle between vectors A and B .arrow_forwardIn an experiment where we will use a vertically-mounted turntable that has a hub attached at its center, which has three grooves of different radius, around which one can wind a string. A mass hanging from the free end of the string provides tension, which exerts a torque on the turntable, thus causing it to rotate What effect does the diameter of the string have on the lever arm? Explain why we can ignore this effect. Please help guide me as to what the string's diameter's effect is on the lever arm, and why this effect can be ignored.arrow_forwardIt is known that the curve vector equation is R(t) = 4t i + 2(t2 – 1) j. Find the unit tangent vector, the curvature, and the radius of curvature at t = 2.arrow_forward
- A 500 N F force is applied to the vertical rod, as shown in picture below. Write F as a function of the unit vectors i and j, and identify their vector and scalar components.arrow_forwardFind τF the torque about point P due to the force applied by the Achilles' tendon. Express your answer in terms of F, ϕ, and x.arrow_forwardWhat is the cross product A x B of the vectors, A = i + 4j + 6k and B = 2i + 3j + 5k ?arrow_forward
- Compute for dot product and cross product for each of the following cases.Identify the units of each product.a. A = 12j + 8k m B = 4i – 2j + 3k mb. A = 5i + 3j m B = 7i – 12k Narrow_forwardThis question is a biomechanics question and all that was given is this: Given a person with a body weight of 100 kg, what peak magnitude of force would you expect to measure at one knee in a person who is walking versus running? Be exact.arrow_forwardThe drawing shows a rectangular peice of wood. The forces applied to corners B and D have the same magnitude of 14 N and are directed parallel to the tlong and short sides of the rectangle. The long side of the rectangle is twice as long as the short side. An axis of rotation is shown perpendicular to the place of the rectangle at its center. A third force (not shown in the drawing) is applied to corner A, directed along the short side of the rectangle (either toward B or away from B), such that the piece of wood is at equillibrium. Find the magnitude and direction of the force applied to corner A.arrow_forward
- The leaning Tower of Pisa is 59.1 m high and 7.44 m in diameter. The top of the tower is displaced 4.01 m from the vertical.Treat the tower as a uniform, circular cylinder. (a) What additional displacement, measured at the top, would bring the tower to the verge of toppling? (b) What angle would the tower then make with the vertical?arrow_forwardI am working on this problem and have been getting wrong answers I am not sure if it is due to integration or not but what I have so far determined is that. Note y1 = y1(x) and y2 = y2(x) distance to dm (r)=x Differential Area (dA) = (y1 - y2) * dx Differential Mass (dm) = sigma * (y1-y2) * dx Differential Moment (dI) = x^2 * sigma(y1-y2)dxarrow_forwardThe tires on new compact car havea diameter of 2.0 ft and are warranted for 60 000 miles, (a) Determine the angle (in radians) throught (which one of these tires will rotate during the warranty period, (b) How many revolutions of the tire are equivalent to your answer in part (a) ?arrow_forward
 Physics for Scientists and Engineers, Technology ...PhysicsISBN:9781305116399Author:Raymond A. Serway, John W. JewettPublisher:Cengage Learning
 Principles of Physics: A Calculus-Based TextPhysicsISBN:9781133104261Author:Raymond A. Serway, John W. JewettPublisher:Cengage Learning
 Physics for Scientists and Engineers: Foundations...PhysicsISBN:9781133939146Author:Katz, Debora M.Publisher:Cengage Learning
 University Physics Volume 1PhysicsISBN:9781938168277Author:William Moebs, Samuel J. Ling, Jeff SannyPublisher:OpenStax - Rice University