
Concept explainers
Videos
(Exercises 27–40) For each description of data, identify the W’s, name the variables, specify for each variable whether its use indicates that it should be treated as categorical or quantitative, and, for any quantitative variable, identify the units in which it was measured (or note that they were not provided).
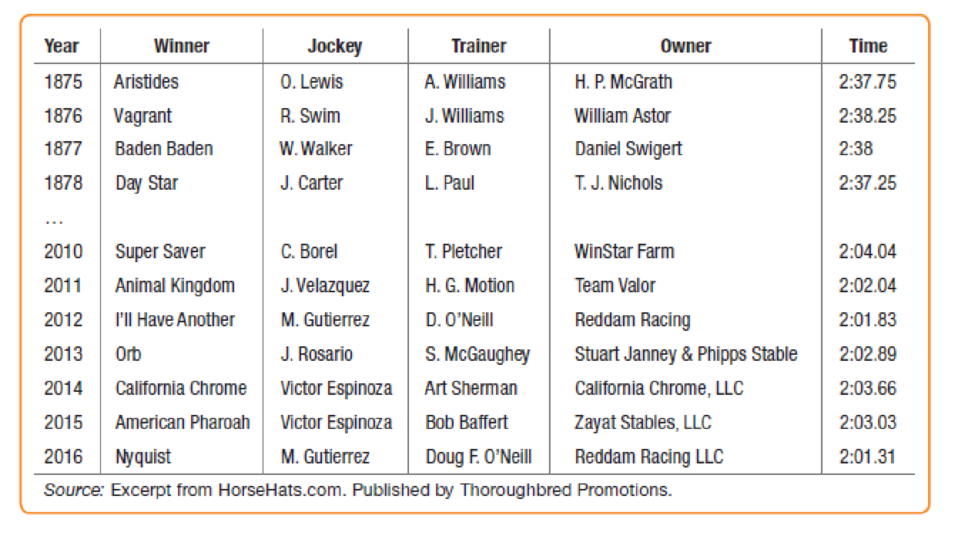
39. Kentucky Derby 2016 The Kentucky Derby is a horse race that has been run every year since 1875 at Churchill Downs in Louisville, Kentucky. The race started as a 1.5-mile race, but in 1896, it was shortened to 1.25 miles because experts felt that 3-year-old horses shouldn’t run such a long race that early in the season. (It has been run in May every year but one—1901—when it took place on April 29.) Above are the data for the first four and seven recent races.
Want to see the full answer?
Check out a sample textbook solution
Chapter 1 Solutions
Intro Stats + New Mylab Statistics With Pearson Etext:


- In 2013 the average houshold credit card balance was $9,884. In 2016 the average houshold credit card balance was $11,184. (a) Compute the average yearly change in credit card balance from 2013 to 2016 (b) Use this to predict what the average credit card balance was in:i. 2014ii. 2015iii. 2017iv. 2018 (c) In 2014 the avearge balance was $10,450 and in 2015 the avearge balance was $10,762. Where your predictions good for those years? (d) In 2017 the average balance was $10,821 and in 2018 the aveage balance was $9,333. Where your predictions good for those years?arrow_forwardDoes drinking coffee affect blood flow, particularly during exercise? Doctors studying healthy subjects measured myocardial blood flow (MBF) during bicycle exercise before and after giving the subjects a dose of caffeine that was equivalent to drinking two cups of coffee. The following table shows the MBF levels before (baseline) and after (caffeine) the subjects took a tablet containing 200 mg of caffeinearrow_forwardsection 4.1 #30 In Exercises 25–30, determine whether the association between the two variables is positive or negative. Weekly ice cream sales and weekly average temperaturearrow_forward
- An aerobic exercise instructor remembers the data given in the following table, which shows the recommended maximum exercise heart rates for individuals of the given ages. Predict the maximum exercise heart rate of a person who is 72 years old Age (x years) 20 30 40 50 60 Maximum heart rate (y beats per minute) 170 168 153 147 136arrow_forwardFor each description of data, identify theW’s, name the variables, specify for each variable whether itsuse indicates that it should be treated as categorical or quantitative, and, for any quantitative variable, identify the units inwhich it was measured (or note that they were not provided) . Streams In performing research for an ecology class, students at a college in upstate New York collect data on localstreams each year. They record a number of biological, chemical, and physical variables, including the streamname, the substrate of the stream (limestone, shale, ormixed), the acidity of the water (pH), the temperature (°C),and the BCI (a numerical measure of biological diversity).arrow_forwardFind the quartic function that is the best fit for the data in the following table. x y-3 61-2 9-1 10 11 -32 13 49 The quartic function that is the best fit for the given data is y=?arrow_forward
- Use this data and create a model that estimates a student's giving rate as an alumni based on the three parameters provided. If a class has a graduation rate of 74, the % of classes under 20 student equal to 55, and a Student=Faculty Ratio of 19, what should we expect our Alumni Giving Rate to be? (Enter a whole number) University Graduation Rate % of Classes Under 20 Student-Faculty Ratio Alumni Giving Rate Boston College 85 39 13 25 Brandeis University 79 68 8 33 Brown University 93 60 8 40 California Institute of Technology 85 65 3 46 Carnegie Mellon University 75 67 10 28 Case Western Reserve Univ. 72 52 8 31 College of William and Mary 89 45 12 27 Columbia University 90 69 7 31 Cornell University 91 72 13 35 Dartmouth College 94 61 10 53 Duke University 92 68 8 45 Emory University 84 65 7 37 Georgetown University 91 54 10 29 Harvard University 97 73 8 46 Johns Hopkins University 89 64 9 27 Lehigh University 81 55 11 40 Massachusetts Inst.…arrow_forwardA soil scientist has just developed a new type of fertilizer and she wants to determine whether it helps carrots grow larger. She sets up several pots of soil and plants one carrot seed in each pot. Fertilizer is added to half the pots. All the pots are placed in a temperature-controlled greenhouse where they receive adequate light and equal amounts of water. After two months of growth, the scientist harvests the carrots and weighs them (in kilograms). Below is a data table showing the weight of the carrots at the end of the growing period from the two treatment groups. When analyzing this dataset with a t-test, the hypothesis states that the average size of the carrots from each treatment are the same, whereas the hypothesis states that the fertilized carrots are larger in size. To analyze this data set, should the scientist use a -tailed t-test? After performing a t-test, what is the calculated t-value for this data set? (Round your answer to four decimal places) Use the…arrow_forwardSeveral states have argued that the 65-mph speed limit has no justification and have refused to enforce it. The federal Department of Transportation (DOT) believes that the 65-mph limit saves lives. To illustrate its contention, the department regressed the number of traffic fatalities (Y) last year in a state on the state’s population (X1), the number of days of snow cover (X2), and the average speed of all cars (X3). The results are shown below. Table 10: Model Summary Model R R Square Adjusted R Square Std. Error of the Estimate 1 .821 a .780 .613 3.258 a. Predictors: (Constant), population, days of snow, average speed Table 11: Coefficients Coefficientsa Model Unstandardized Coefficients Standardized Coefficients t Sig. B Std. Error Beta 1 (Constant) 1.4 2.957 .473 .584 Population .00029 .00003 .0034 9.667 .000 Days of Snow 2.4 .62 .759 3.871 .000 Average Speed 10.3 1.1…arrow_forward
- Part c: What percentage of an adult size brain does a child have at age 10? Part d: Determine whether the value from the model is larger or smaller than the value in the table.arrow_forwardA fisherman has collected data about the length in inches, L, and weight in ounces, w, of fish he has caught. The resulting line of best fit for the data is w=−37.1+3.2L. Would predicting the weight of a 26-inch fish be interpolation or extrapolation? Explain. L 13 14 15 16 18 21 23 23 w 3 10 10 15 20 35 38 45 Using the model to predict the weight of a 26-inch fish is extrapolation because 26 inches is outside the range of the lengths in the data. Using the model to predict the weight of a 26-inch fish is interpolation because 26 inches is inside the range of the lengths in the data. Using the model to predict the weight of a 26-inch fish is extrapolation because 26 inches is inside the range of the lengths in the data. Using the model to predict the weight of a 26-inch fish is interpolation because 26 inches is outside the range of the lengths in the data.arrow_forwardOcean currents are important in studies of climate change, as well as ecology studies of dispersal of plankton. Drift bottles are used to study ocean currents in the Pacific near Hawaii, the Solomon Islands, New Guinea, and other islands. Let x represent the number of days to recovery of a drift bottle after release and y represent the distance from point of release to point of recovery in km/100. The following data are representative of one study using drift bottles to study ocean currents. x days 76 79 36 95 207 y km/100 14.2 19.6 5.4 11.2 35.9 (a) Verify that Σx = 493, Σy = 86.3, Σx2 = 65,187, Σy2 = 2029.21, Σxy = 11317.3, and r ≈ 0.93885. Σx Σy Σx2 Σy2 Σxy r (b) Use a 1% level of significance to test the claim ρ > 0. (Use 2 decimal places.) t critical t (c) Verify that Se ≈ 4.6183, a ≈ 0.5575, and b ≈ 0.1694. Se a b Find the predicted distance (km/100) when a drift bottle has been floating for 60 days. (Use 2…arrow_forward
 Algebra & Trigonometry with Analytic GeometryAlgebraISBN:9781133382119Author:SwokowskiPublisher:Cengage
 Big Ideas Math A Bridge To Success Algebra 1: Stu...AlgebraISBN:9781680331141Author:HOUGHTON MIFFLIN HARCOURTPublisher:Houghton Mifflin Harcourt