Concept explainers
Videos
In a pressure-fed journal bearing, forced cooling is provided by a pressurized lubricant flowing along the axial direction of the shaft (the x -direction) as shown in fig. P1.43. The lubricant 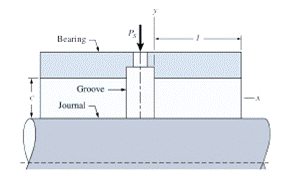
Pressure satisfies the linear equation
(a) Using the data given in the table (Fig. P1.43). find the equation of the line for the lubricant pressure
(c) Sketch the graph of the lubricant pressure
Want to see the full answer?
Check out a sample textbook solution
Chapter 1 Solutions
Introductory Mathematics for Engineering Applications
Additional Math Textbook Solutions
Fundamentals of Differential Equations (9th Edition)
Advanced Engineering Mathematics
Basic Technical Mathematics
Using and Understanding Mathematics: A Quantitative Reasoning Approach (6th Edition)
Elementary Statistics Using The Ti-83/84 Plus Calculator, Books A La Carte Edition (5th Edition)
Calculus 2012 Student Edition (by Finney/Demana/Waits/Kennedy)


- In a simple ridge regression model, if the (x, y) pairs (0, 1) and (1, 0) yield the same error factor (E or e) of value 2, which of the following may be (closest) used for the regularization parameter λ? a) λ = 0.0 b)λ = 0.5 c)λ = 1.0 d)λ = 1.5arrow_forwardSuppose a bee follows the trajectory, at what values of T is the bee flying vertically and or horizontally?arrow_forwardA set of X and Y scores has SSX = 15, SSY = 24, and SP = 60. The regression equation for these scores will have a slope constant of ______. a. 6 b. 5 c. 3 d. 4arrow_forward
- Given are five observations for two variables, x and y. xi 1 2 3 4 5 yi 3 8 6 10 13 (d) Develop the estimated regression equation by computing the values of b0 and b1 using b1 = Σ(xi − x)(yi − y) Σ(xi − x)2 and b0 = y − b1x. ŷ = (e) Use the estimated regression equation to predict the value of y when x = 2.arrow_forwardA set of X and Y scores has SSX = 5, SSY = 7.5, and SP = 15. The regression equation for these scores will have a slope constant of 2. true or false?arrow_forwardThe table below shows the number of state-registered automatic weapons and the murder rate for several Northwestern states. x 11.9 8.6 7.1 3.8 2.3 2.3 2.2 0.3 y 14.3 11 9.9 7.3 5.7 5.7 5.6 4.1 x = thousands of automatic weaponsy = murders per 100,000 residentsThis data can be modeled by the equation y=0.87x+3.75. Use this equation to answer the following; Special Note: I suggest you verify this equation by performing linear regression on your calculator.A) How many murders per 100,000 residents can be expected in a state with 5 thousand automatic weapons?Answer = Round to 3 decimal places.B) How many murders per 100,000 residents can be expected in a state with 10.5 thousand automatic weapons?Answer = Round to 3 decimal places.arrow_forward
- 1) create a line in DESMOS with the linear regression equation: y1 ~ mx1 + b 2) create a second line with quadratic regression: y1 ~ ax1^2 + bx + c After looking at the regression in DESMOS, is the data LINEAR or QUADRATIC?arrow_forwardGiven r = 0.8, MX = 10, Sx = 2, MY = 6, and SY = 1, what is the regression equation? Next, when X is 2, what is the predicted Y value?arrow_forwardThe table below shows the number of state-registered automatic weapons and the murder rate for several Northwestern states. x 11.5 8.5 6.7 3.8 2.6 2.5 2.3 0.4 y 13.9 11.4 9.5 7.1 6.3 6.2 6.1 4.2 x = thousands of automatic weaponsy = murders per 100,000 residents This data can be modeled by the equation y=0.86x+3.96. Use this equation to answer the following; Special Note: I suggest you verify this equation by performing linear regression on your calculator. A) How many murders per 100,000 residents can be expected in a state with 1.8 thousand automatic weapons? Answer = Round to 3 decimal places. B) How many murders per 100,000 residents can be expected in a state with 9.7 thousand automatic weapons? Answer = Round to 3 decimal places.arrow_forward
- The following chart is data over an 8-month period that shows how much a company spent in advertising and the sales revenue for that month MONTH ADVERTISING $ SALES $ March 900 56000 April 2700 89200 May 3150 98500 June 1300 54000 July 3400 97000 Aug 1500 56000 Sept 2300 93000 Oct 2250 79000 What is the linear equation (y = mx + b form) that best approximates the relationship between advertising dollars spent(x) and sales revenue(y) based on the above 8 months of data? (round to 2 decimals for the slope and the y intercept) describe how you utilized excel to arrive at this equationarrow_forwardGiven the “data” determined by y = x^3 + (x-1)^2 with x = 0.1, 1.2, 2.3, and 2.9, calculate SSTO, SSR, and R^2. Then recalculate these using x = 0.3, 1, 2.45, and 2.8. Does where you collect your data (i.e., which values of x) appear to impact your interpretation of how good the linear model fits?.arrow_forwardQ, 1: Environtech Engineering, a company that specializes in the construction of antipollution filtration devices, has recorded the following sales record over the last 9 years: Year 1987 1988 1989 1990 1991 1992 1993 1994 1995 Sales (x 100,000) 13 15 19 21 27 35 47 49 97 a) Plot these data with suitable scale and define shape. b) Develop the linear estimating equation that best describes these data, and plot this line on the graph from part (a). c) Develop the second-degree estimating equation that best describes these data, and plot this curve on the graph from part (a). d) Does the market to the best of your knowledge favor (b) or (c) as the more accurate estimating method?arrow_forward
 Algebra: Structure And Method, Book 1AlgebraISBN:9780395977224Author:Richard G. Brown, Mary P. Dolciani, Robert H. Sorgenfrey, William L. ColePublisher:McDougal Littell
 Algebra & Trigonometry with Analytic GeometryAlgebraISBN:9781133382119Author:SwokowskiPublisher:Cengage