
Concept explainers
Videos
(a) Determine s on the transmission line of Figure 10.32. Note that the dielectric is air. (b) Find the input impedance. (c) If
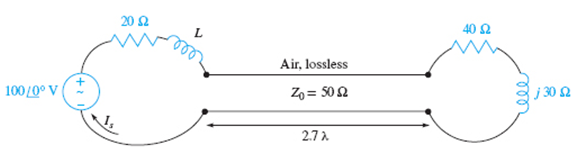
Figure 10.32 See Problem 10.20.
(a)
The value ofs on the transmission line.
Answer to Problem 10.20P
The value of son the transmission line is 2.
Explanation of Solution
Given:
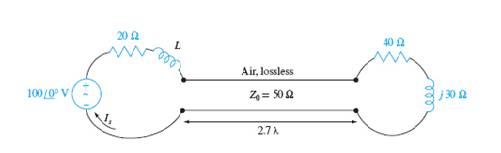
The given figure is shown below.

Concept Used:
The term s is calculated by
Calculation:
The reflection coefficient is
The magnitude of the reflection coefficient is,
The standing wave ratio is calculated as
Conclusion:
The value of s in the transmission line is 2.
(b)
The input impedance.
Answer to Problem 10.20P
The input impedance of the transmission line is
Explanation of Solution
Given:
The given figure is shown below.
Concept Used:
The input impedance is calculated by
Calculation:
The input impedance of the transmission line is calculated as
Let
Conclusion:
The input impedance of the transmission line is
(c)
The source current
Answer to Problem 10.20P
The source current is
Explanation of Solution
Given:

Calculation:
The source current is calculated by
Let
Conclusion:
Thus, the source current is
(d)
The value of L which produces maximum value for
Answer to Problem 10.20P
The value of L which produces maximum value for
Explanation of Solution
Given:
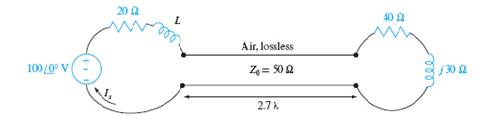
The given circuit is shown below.
Concept Used:
The maximum value of L is calculated by
Calculation:
The magnitude of the source current is,
Differentiating with respect to L,
Conclusion:
The value of L which produces maximum value for
(e)
The average power delivered by the source.
Answer to Problem 10.20P
The average power delivered by the source is,
Explanation of Solution
Given:
The given circuit is shown below.

Concept Used:
The average power is calculated by
Calculation:
Considering the real part only
Average power is calculated as
Conclusion:
Thus, the average power delivered by the source is,
(f)
Average power delivered to ZL.
Answer to Problem 10.20P
The average power delivered to the load is
Explanation of Solution
Given:

Concept Used:
The average power delivered is calculated by
Calculation:
Thus, the total power delivered to the load is
Conclusion:
Thus, the average power delivered to the load is
Want to see more full solutions like this?
Chapter 10 Solutions
Engineering Electromagnetics


- A.) An FM signal , 2000 sin(2π x 108t + 2sin πx 104t), is applied to a 50 ohms antenna. Determine: (a) The carrier frequency. (b) The transmitter power. (c) The modulating index. (d) The intelligence signal frequency. (e) The bandwidth (using the two methods) (f) The power in the largest and smallest side bands.arrow_forwardA cellular radio transmitter has a power output of 3W operating at a frequency of 800MHz, using a 7dB gain antenna. The receiver is located at a distance of 8km with a 12dB antenna from this point. A)Calculate the power received at the receiver and express it in dBm.B)Now consider losses in the transmission lines in both the transmitter and receiver of 1dB and 1.5dB respectively, and calculate the power received at the receiver.arrow_forwardA satellite receiving system is designed using a dish antenna of 40dB gain. The effective radiated power of the TV broadcast satellite, which is 36000 km above the earth, has ERP=50dBW output power. Calculate the received signal power.arrow_forward
- DISCRETE TIME GIVEN SYSTEM.Determine the poles and zeros of this system, and show how they relate to each other.The system is only marginally stable True False Find the frequency response of this system. ( NEED NEAT HANDWRITTEN SOLUTION ONLY OTHERWISE DOWNVOTE).arrow_forwardFind out the general solution for a transmission line due to transient voltage,where ,e = f(x-at) + F(x+at)arrow_forwardA satellite at an altitude of 37654 km transmits a signal of 17 GHz to a ground station directly below it. The following data is given. • Total atmospheric losses = 40dB • Transmit antenna gain = 55dBi • Receiver antenna gain = 60dBi • Signal to noise ratio of received signal = 6dB • Receiver signal noise power = 25pW • Receiver sensitivity = -90dBW I. Calculate the power transmitted. II. Find the Fade Margin for the link and comment on your result.arrow_forward
- 1. An AM standard broadcast station has a Lower sideband and an upper side band frequency of 770KHz and 780KHz, respectively. If the AM station is transmitting a frequency of 775KHz, calculate the: a. Total bandwidth occupied by the AM station.arrow_forwardAn FM transmitter delivers, to a 75-Ohm antenna, a signal of v = 1000 sin ( 10^9t + 4 sin 10^4t). Calculate the carrier and intelligence frequencies, power, modulation index, deviation, and bandwidth.arrow_forwardGiven the following message, m(t), carrier, c(t), and Kvco=4500(Hz/v), determine the FM modulated signal equation and FM index. m(t)=2cos(2π3500t), c(t)=4cos(2π5MHzt). With explain a. s(t)=2cos(2π5E6t + 1.56sin(2π3500t)), β=1.56 b. s(t)=2cos(2π3500t + 1.56sin(2π5E6t)), β=1.56 c. s(t)=4cos(2π5E6t + 2.57sin(2π3500t)), β=2.57 d. s(t)=4cos(2π3500t + 2.57sin(2π5MHz*t)), β=2.57arrow_forward
- In an AM transmission system the transmitter current was found to be 9.A. If the carrier signal is the only one to be sent and later increases to 10.72 A. Also if the carrier is modulated by a single sinusoidal wave, compute the percentage modulation. Again find the current of the antenna if the percentage of modulation changes 85%.arrow_forwardA frequency modulated signal is generated by modulating the carrier signal c(t) = 40 cos(2pi fc t),with fc = 106 MHz.The phase function of the FM modulated signal is known to be phase(t) = 10 sin(12,000pi t).Determine1. the average transmitted power of the FM modulated signal u(t),2. the peak-phase deviation,3. the peak-frequency deviation,4. the bandwidth of the FM modulated signal.arrow_forwardA cellular radio system based on GSM 1800 has ht = 20 m and hr = 2 m, Gt = 5 dB and Gr = 2 dB. The transmitter (radio base station, RBS) radiated power, Pt = 10 W. The distance between RBS and the mobile station (MS) is 2 km. Determine the received power (dBm) using (i) the Free space propagation model. (ii) Plane Earth Path propagation modelarrow_forward
 Introductory Circuit Analysis (13th Edition)Electrical EngineeringISBN:9780133923605Author:Robert L. BoylestadPublisher:PEARSON
 Delmar's Standard Textbook Of ElectricityElectrical EngineeringISBN:9781337900348Author:Stephen L. HermanPublisher:Cengage Learning
 Programmable Logic ControllersElectrical EngineeringISBN:9780073373843Author:Frank D. PetruzellaPublisher:McGraw-Hill Education
 Fundamentals of Electric CircuitsElectrical EngineeringISBN:9780078028229Author:Charles K Alexander, Matthew SadikuPublisher:McGraw-Hill Education
 Electric Circuits. (11th Edition)Electrical EngineeringISBN:9780134746968Author:James W. Nilsson, Susan RiedelPublisher:PEARSON
 Engineering ElectromagneticsElectrical EngineeringISBN:9780078028151Author:Hayt, William H. (william Hart), Jr, BUCK, John A.Publisher:Mcgraw-hill Education,