Fundamentals Of Cost Accounting (6th Edition)
6th Edition
ISBN: 9781259969478
Author: WILLIAM LANEN, Shannon Anderson, Michael Maher
Publisher: McGraw Hill Education
expand_more
expand_more
format_list_bulleted
Videos
Textbook Question
Chapter 10, Problem 50E
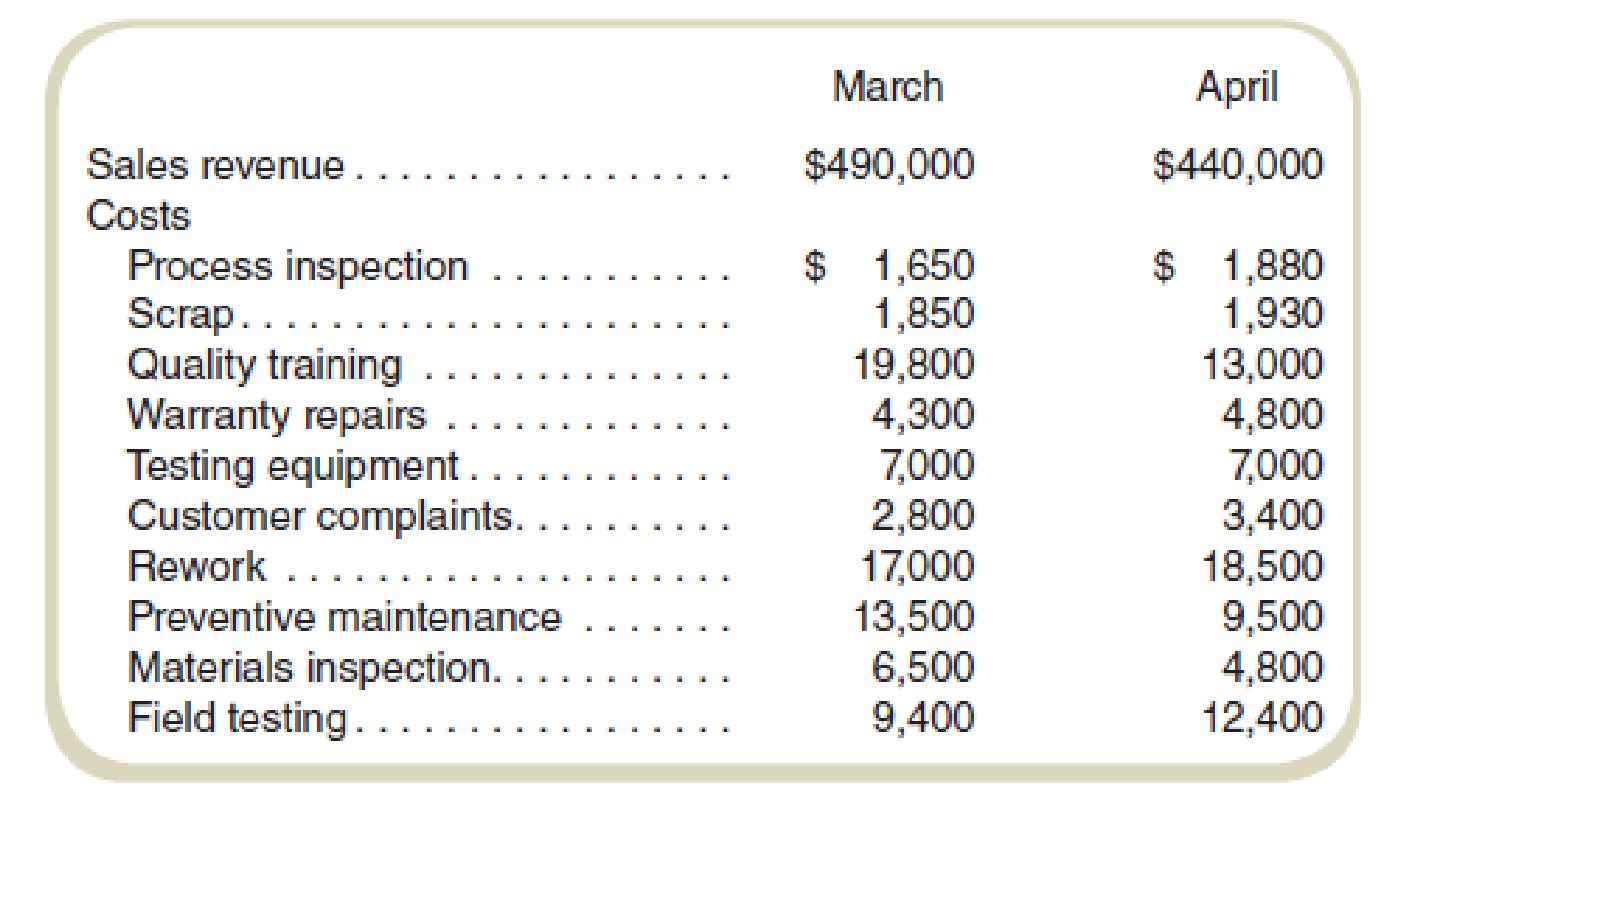
Costs of Quality
The following represents the financial information for Domingo Corporation for two months:
Required
- a. Classify these items into prevention (P), appraisal (A), internal failure (IF), or external failure (EF) costs.
- b. Calculate the ratio of the prevention, appraisal, internal failure, and external failure costs to sales for March and April.
Expert Solution & Answer
Want to see the full answer?
Check out a sample textbook solution
Chapter 10 Solutions
Fundamentals Of Cost Accounting (6th Edition)
Ch. 10 - How are activity-based costing and activity-based...Ch. 10 - Can activity-based management be implemented...Ch. 10 - Prob. 3RQCh. 10 - What are some ways in which customers affect a...Ch. 10 - How is computing the cost of customers the same as...Ch. 10 - Prob. 6RQCh. 10 - Prob. 7RQCh. 10 - Under what conditions should the cost of excess...Ch. 10 - In what ways does quality affect cost?Ch. 10 - What are the four categories in a cost of quality...
Ch. 10 - Prob. 11CADQCh. 10 - Prob. 12CADQCh. 10 - Consider a library that spends 25,000 to move most...Ch. 10 - Prob. 14CADQCh. 10 - Prob. 15CADQCh. 10 - You can get the cost of customers by first...Ch. 10 - Prob. 17CADQCh. 10 - Prob. 18CADQCh. 10 - Prob. 19CADQCh. 10 - Prob. 20CADQCh. 10 - Many if not most schools in the United States have...Ch. 10 - Prob. 22CADQCh. 10 - Prob. 23CADQCh. 10 - Prob. 25ECh. 10 - Prob. 26ECh. 10 - Prob. 27ECh. 10 - Cost Hierarchy for a Not-for-Profit Below are...Ch. 10 - Prob. 29ECh. 10 - Driver Identification Below are various activities...Ch. 10 - Activity-Based Costing of Customers Marvins...Ch. 10 - Activity-Based Costing of Customers Rock Solid...Ch. 10 - Prob. 33ECh. 10 - Prob. 34ECh. 10 - Prob. 35ECh. 10 - Activity-Based Costing of Suppliers Hult Games...Ch. 10 - Prob. 37ECh. 10 - Activity-Based Costing of Suppliers Kinnear...Ch. 10 - Prob. 39ECh. 10 - Resources Used versus Resources Supplied Tri-State...Ch. 10 - Prob. 41ECh. 10 - Resources Used versus Resources Supplied Conlon...Ch. 10 - Prob. 43ECh. 10 - Prob. 44ECh. 10 - Prob. 45ECh. 10 - Prob. 46ECh. 10 - Assigning Cost of Capacity Mimis Fixtures...Ch. 10 - Assigning Cost of Capacity Curts Casting...Ch. 10 - Prob. 49ECh. 10 - Costs of Quality The following represents the...Ch. 10 - Prob. 51ECh. 10 - Costs of Quality Nuke-It-Now manufactures...Ch. 10 - Prob. 53ECh. 10 - Cost of Quality: Environmental Issues Many...Ch. 10 - Prob. 55ECh. 10 - Prob. 56PCh. 10 - Activity-Based Reporting: Service Organization...Ch. 10 - Prob. 58PCh. 10 - Customer Profitability Carmel Company has a...Ch. 10 - Activity-Based Costing of Suppliers JFI Foods...Ch. 10 - Prob. 61PCh. 10 - Prob. 62PCh. 10 - Prob. 63PCh. 10 - Activity-Based Reporting: Manufacturing...Ch. 10 - Assigning Capacity Costs Cathy and Toms Specialty...Ch. 10 - Prob. 66PCh. 10 - Prob. 67PCh. 10 - Assigning Capacity Costs Mercia Chocolates...Ch. 10 - Prob. 69PCh. 10 - Prob. 70PCh. 10 - Prob. 71P
Knowledge Booster


Learn more about
Need a deep-dive on the concept behind this application? Look no further. Learn more about this topic, accounting and related others by exploring similar questions and additional content below.Similar questions
- Use the following information for Exercises 2-47 through 2-49. Jasper Company provided the following information for last year: Last year, beginning and ending inventories of work in process and finished goods equaled zero. Exercise 2-49 Income Statement Refer to the information for Jasper Company on the previous page. Required: 1. Prepare an income statement for Jasper for last year. Calculate the percentage of sales for each line item on the income statement. (Note: Round percentages to the nearest tenth of a percent.) 2. CONCEPTUAL CONNECTION Briefly explain how a manager could use the income statement created for Requirement 1 to better control costs.arrow_forwardQuality Cost Report Loring Company had total sales of 2,400,000 for fiscal 20X1. The costs of quality-related activities are given below. Required: 1. Prepare a quality cost report, classifying costs by category and expressing each category as a percentage of sales. What message does the cost report provide? 2. Prepare a bar graph and pie chart that illustrate each categorys contribution to total quality costs. Comment on the significance of the distribution.arrow_forwardBradshaw Company reported sales of 5,000,000 in 20X1. At the end of the fiscal year (June 30, 20X1), the following quality costs were reported: Required: 1. Prepare a quality cost report. 2. Prepare a graph (pie chart or bar graph) that shows the relative distribution of quality costs, and comment on the distribution. 3. Assuming sales of 5,000,000, by how much would profits increase if quality improves so that quality costs are only 3% of sales?arrow_forward
- Using the information in the previous exercises about Marleys Manufacturing, determine the operating income for department B, assuming department A sold department B 1,000 units during the month and department A reduces the selling price to the market price.arrow_forwardCost of quality report A. Using the information in Exercise 15, identify the cost of quality classification for each activity. B. Prepare a cost of quality report. Assume sales for the period were 4,000,000. Round percentages to one decimal place. C. Interpret the cost of quality report.arrow_forwardEthics in Action In August, Lannister Company introduced a new performance measurement system in manufacturing operations. One of the new performance measures is lead time, which is determined by tagging a random sample of items with a log sheet throughout the month. The log sheets recorded the time that the sample items started production and the time that they ended production, as well as all steps in between. At the end of the month, the controller collected the log sheets and computed the average lead time of the tagged products. This number was reported to central management and was used to evaluate the performance of the plant manager. Because of the poor lead time results reported for August, the plant was under extreme pressure to reduce lead time in September. The following memo was intercepted by the controller. Date: September 3 To: Hourly Employees From: Plant Manager During last month, you may have noticed that some of the products were tagged with a log sheet. This sheet records the time that a product enters production and the time that it leaves production. The difference between these two times is termed the lead time. Our plant is evaluated on improving lead time. From now on, I ask all of you to keep an eye out for the tagged items. When you see a tagged item, it is to receive special attention. Work on that item first, and then immediately move it to the next operation. Under no circumstances should tagged items wait on any other work that you have. Naturally, report accurate information. I insist that you record the correct times on the log sheet as the product goes through your operations. How should the controller respond to this discovery?arrow_forward
- Scattergraph, High-Low Method, and Predicting Cost for a Different Time Period from the One Used to Develop a Cost Formula Refer to the information for Farnsworth Company on the previous page. Required: 1. Prepare a scattergraph based on the 10 months of data. Does the relationship appear to be linear? 2. Using the high-low method, prepare a cost formula for the receiving activity. Using this formula, what is the predicted cost of receiving for a month in which 1,450 receiving orders are processed? 3. Prepare a cost formula for the receiving activity for a quarter. Based on this formula, what is the predicted cost of receiving for a quarter in which 4,650 receiving orders are anticipated? Prepare a cost formula for the receiving activity for a year. Based on this formula, what is the predicted cost of receiving for a year in which 18,000 receiving orders are anticipated? Use the following information for Problems 3-60 and 3-61: Farnsworth Company has gathered data on its overhead activities and associated costs for the past 10 months. Tracy Heppler, a member of the controllers department, has convinced management that overhead costs can be better estimated and controlled if the fixed and variable components of each overhead activity are known. One such activity is receiving raw materials (unloading incoming goods, counting goods, and inspecting goods), which she believes is driven by the number of receiving orders. Ten months of data have been gathered for the receiving activity and are as follows:arrow_forwardRoss Company implemented a quality improvement program and tracked the following for the five years: By cost category as a percentage of sales for the same period of time: Required: 1. Prepare a bar graph that reveals the trend in quality cost as a percentage of sales (time on the horizontal axis and percentages on the vertical). Comment on the message of the graph. 2. Prepare a bar graph for each cost category as a percentage of sales. What does this graph tell you? 3. What if management would like to have the trend in relative distribution of quality costs? Express this as a bar graph and comment on its significance.arrow_forwardQuality Cost Report Whitley Company had total sales of 1,000,000 for the year ending 20X1. The costs of quality are given below. Required: 1. Prepare a quality cost report, classifying costs by category and expressing each category as a percentage of sales. What message does the cost report provide? 2. Prepare a bar graph and pie chart that illustrate each categorys contribution to total quality costs. Comment on the significance of the distribution.arrow_forward
- Norris Company implemented a quality improvement program and tracked the following for the 5 years: By cost category of sales for the same period of time: Required: 1. Prepare a bar graph (hat reveals the trend in quality cost as a percentage of sales (time on horizontal axis and percentages on the vertical). Comment on the message of the graph. 2. Prepare a bar graph for each cost category as a percentage of sales. What does this graph tell you?arrow_forwardPintura Company implemented a quality improvement program and tracked the following for the five years: By cost category as a percentage of sales for the same period of time: Required: 1. Prepare a bar graph that reveals the trend in quality cost as a percentage of sales (time on the horizontal axis and percentages on the vertical). Comment on the message of the graph. 2. Prepare a bar graph for each cost category as a percentage of sales. What does this graph tell you?arrow_forwardEllerson Company provided the following information for the last calendar year: During the year, direct materials purchases amounted to 278,000, direct labor cost was 189,000, and overhead cost was 523,000. During the year, 100,000 units were completed. Refer to Exercise 2.21. Last calendar year, Ellerson recognized revenue of 1,312,000 and had selling and administrative expenses of 204,600. Required: 1. What is the cost of goods sold for last year? 2. Prepare an income statement for Ellerson for last year.arrow_forward
arrow_back_ios
SEE MORE QUESTIONS
arrow_forward_ios
Recommended textbooks for you
 Financial And Managerial AccountingAccountingISBN:9781337902663Author:WARREN, Carl S.Publisher:Cengage Learning,
 Managerial AccountingAccountingISBN:9781337912020Author:Carl Warren, Ph.d. Cma William B. TaylerPublisher:South-Western College Pub
 Cornerstones of Cost Management (Cornerstones Ser...AccountingISBN:9781305970663Author:Don R. Hansen, Maryanne M. MowenPublisher:Cengage Learning
 Principles of Accounting Volume 2AccountingISBN:9781947172609Author:OpenStaxPublisher:OpenStax College
 Managerial Accounting: The Cornerstone of Busines...AccountingISBN:9781337115773Author:Maryanne M. Mowen, Don R. Hansen, Dan L. HeitgerPublisher:Cengage Learning
 College Accounting, Chapters 1-27AccountingISBN:9781337794756Author:HEINTZ, James A.Publisher:Cengage Learning,
Financial And Managerial Accounting
Accounting
ISBN:9781337902663
Author:WARREN, Carl S.
Publisher:Cengage Learning,
Managerial Accounting
Accounting
ISBN:9781337912020
Author:Carl Warren, Ph.d. Cma William B. Tayler
Publisher:South-Western College Pub
Cornerstones of Cost Management (Cornerstones Ser...
Accounting
ISBN:9781305970663
Author:Don R. Hansen, Maryanne M. Mowen
Publisher:Cengage Learning
Principles of Accounting Volume 2
Accounting
ISBN:9781947172609
Author:OpenStax
Publisher:OpenStax College
Managerial Accounting: The Cornerstone of Busines...
Accounting
ISBN:9781337115773
Author:Maryanne M. Mowen, Don R. Hansen, Dan L. Heitger
Publisher:Cengage Learning
College Accounting, Chapters 1-27
Accounting
ISBN:9781337794756
Author:HEINTZ, James A.
Publisher:Cengage Learning,
Inspection and Quality control in Manufacturing. What is quality inspection?; Author: Educationleaves;https://www.youtube.com/watch?v=Ey4MqC7Kp7g;License: Standard youtube license