
Managerial Accounting: The Cornerstone of Business Decision-Making
7th Edition
ISBN: 9781337115773
Author: Maryanne M. Mowen, Don R. Hansen, Dan L. Heitger
Publisher: Cengage Learning
expand_more
expand_more
format_list_bulleted
Videos
Textbook Question
Chapter 13, Problem 41E
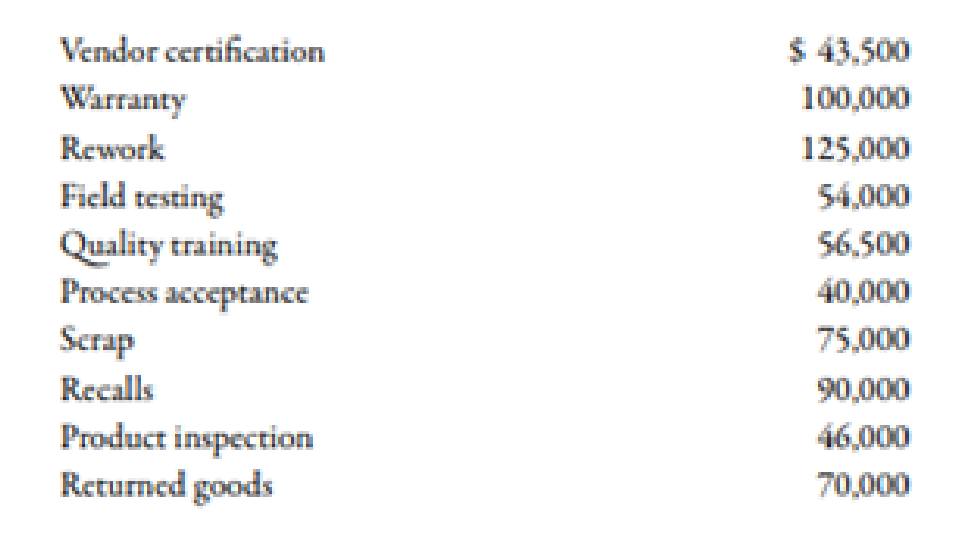
Bradshaw Company reported sales of $5,000,000 in 20X1. At the end of the fiscal year (June 30, 20X1), the following quality costs were reported:
Required:
- 1. Prepare a quality cost report.
- 2. Prepare a graph (pie chart or bar graph) that shows the relative distribution of quality costs, and comment on the distribution.
- 3. Assuming sales of $5,000,000, by how much would profits increase if quality improves so that quality costs are only 3% of sales?
Expert Solution & Answer

Trending nowThis is a popular solution!

Chapter 13 Solutions
Managerial Accounting: The Cornerstone of Business Decision-Making
Ch. 13 - Prob. 1DQCh. 13 - Prob. 2DQCh. 13 - Why should the incremental cost of a risk response...Ch. 13 - Prob. 4DQCh. 13 - Explain how performance measurement can help...Ch. 13 - Identify and discuss the four kinds of quality...Ch. 13 - Discuss the benefits of quality cost reports that...Ch. 13 - Prob. 8DQCh. 13 - Prob. 9DQCh. 13 - When will the average unit cost be used for value...
Ch. 13 - How do international issues affect the role of the...Ch. 13 - What it a foreign trade zone, and what advantages...Ch. 13 - Prob. 13DQCh. 13 - Prob. 14DQCh. 13 - Prob. 15DQCh. 13 - A fire insurance policy on a manufacturing plant...Ch. 13 - Prob. 2MCQCh. 13 - Prob. 3MCQCh. 13 - Which of the following risk response items would...Ch. 13 - Beginning with strategy, which of the following...Ch. 13 - In which areas of an organizations value chain can...Ch. 13 - Prob. 7MCQCh. 13 - Which of the following items (correctly describes...Ch. 13 - Which of the following is a prevention cost? a....Ch. 13 - Prob. 10MCQCh. 13 - Prob. 11MCQCh. 13 - Prob. 12MCQCh. 13 - Prob. 13MCQCh. 13 - A manufacturing cell within a value stream has...Ch. 13 - Prob. 15MCQCh. 13 - Prob. 16MCQCh. 13 - Prob. 17MCQCh. 13 - Prob. 18MCQCh. 13 - Prob. 19MCQCh. 13 - Prob. 20BEACh. 13 - Quality Cost Report Whitley Company had total...Ch. 13 - Andresen Company had the following quality costs...Ch. 13 - Norris Company implemented a quality improvement...Ch. 13 - Mabbut Company has the following departmental...Ch. 13 - During the week of May 10, Hyrum Manufacturing...Ch. 13 - Prob. 26BEACh. 13 - Prob. 27BEBCh. 13 - Quality Cost Report Loring Company had total sales...Ch. 13 - Cassara, Inc., had the following quality costs for...Ch. 13 - Pintura Company implemented a quality improvement...Ch. 13 - Gumbrecht Company has the following departmental...Ch. 13 - During the week of August 21, Parley Manufacturing...Ch. 13 - Prob. 33BEBCh. 13 - Prob. 34ECh. 13 - Prob. 35ECh. 13 - Crazy Fan Guard Company provides security services...Ch. 13 - Jacks Apps Company researches, develops, and sells...Ch. 13 - Prob. 38ECh. 13 - Prob. 39ECh. 13 - Classify the following quality costs as prevention...Ch. 13 - Bradshaw Company reported sales of 5,000,000 in...Ch. 13 - The controller of Emery, Inc. has computed quality...Ch. 13 - Erba Inc. has the following departmental layout...Ch. 13 - A value stream has three activities and two...Ch. 13 - A Box Scorecard was prepared for a value stream:...Ch. 13 - Match each term in Column A with its related...Ch. 13 - Match each term in Column A with its related...Ch. 13 - Prob. 48ECh. 13 - Refer to Exercise 13-48. Suppose that Kamber is...Ch. 13 - Prob. 50ECh. 13 - Prob. 51PCh. 13 - Prob. 52PCh. 13 - Dorsey Scott MU Company manufactures and bottles a...Ch. 13 - Danna Wise, president of Tidwell Company, recently...Ch. 13 - Prob. 55PCh. 13 - In 20X1, Don Blackburn, president of Price...Ch. 13 - Brasher Company is transitioning to a lean...Ch. 13 - Merkley Company, a manufacturer of machine parts,...Ch. 13 - Paladin Company manufactures plain paper fax...Ch. 13 - Custom Shutters. Inc., manufactures plantation...Ch. 13 - Prob. 61PCh. 13 - Corporate sustainability reports vary greatly...Ch. 13 - Luna Company is a printing company and a...Ch. 13 - Lindell Manufacturing embarked on an ambitious...Ch. 13 - Paterson Company, a U.S.-based company,...
Knowledge Booster


Learn more about
Need a deep-dive on the concept behind this application? Look no further. Learn more about this topic, accounting and related others by exploring similar questions and additional content below.Similar questions
- Evans Company had total sales of 3,000,000 for fiscal 20x5. The costs of quality-related activities are given below. Required: 1. Prepare a quality cost report, classifying costs by category and expressing each category as a percentage of sales. What message does the cost report provide? 2. Prepare a bar graph and pie chart that illustrate each categorys contribution to total quality costs. Comment on the significance of the distribution. 3. What if, five years from now, quality costs are 7.5 percent of sales, with control costs being 65 percent of the total quality costs? What would your conclusion be?arrow_forwardKang Company reported sales of 3,240,000 in 20x5. At the end of the calendar year, the following quality costs were reported: Required: 1. Prepare a quality cost report. 2. Prepare a graph (pie chart or bar graph) that shows the relative distribution of quality costs, and comment on the distribution.arrow_forwardNabors Company had actual quality costs for the year ended June 30, 20x5, as given below. At the zero-defect state, Nabors expects to spend 375,000 on quality engineering, 75,000 on vendor certification, and 50,000 on packaging inspection. Assume sales to be 25,000,000. Required: 1. Prepare a long-range performance report for 20x5. What does this report tell the management of Nabors? 2. Explain why quality costs still are present for the zero-defect state. 3. What if Nabors achieves the zero-defect state reflected in the report? What are some of the implications of this achievement?arrow_forward
- Quality Cost Report Loring Company had total sales of 2,400,000 for fiscal 20X1. The costs of quality-related activities are given below. Required: 1. Prepare a quality cost report, classifying costs by category and expressing each category as a percentage of sales. What message does the cost report provide? 2. Prepare a bar graph and pie chart that illustrate each categorys contribution to total quality costs. Comment on the significance of the distribution.arrow_forwardQuality Cost Report Whitley Company had total sales of 1,000,000 for the year ending 20X1. The costs of quality are given below. Required: 1. Prepare a quality cost report, classifying costs by category and expressing each category as a percentage of sales. What message does the cost report provide? 2. Prepare a bar graph and pie chart that illustrate each categorys contribution to total quality costs. Comment on the significance of the distribution.arrow_forwardGagnon Company reported the following sales and quality costs for the past four years. Assume that all quality costs are variable and that all changes in the quality cost ratios are due to a quality improvement program. Required: 1. Compute the quality costs for all four years. By how much did net income increase from Year 1 to Year 2 because of quality improvements? From Year 2 to Year 3? From Year 3 to Year 4? 2. The management of Gagnon Company believes it is possible to reduce quality costs to 2.5 percent of sales. Assuming sales will continue at the Year 4 level, calculate the additional profit potential facing Gagnon. Is the expectation of improving quality and reducing costs to 2.5 percent of sales realistic? Explain. 3. Assume that Gagnon produces one type of product, which is sold on a bid basis. In Years 1 and 2, the average bid was 400. In Year 1, total variable costs were 250 per unit. In Year 3, competition forced the bid to drop to 380. Compute the total contribution margin in Year 3 assuming the same quality costs as in Year 1. Now, compute the total contribution margin in Year 3 using the actual quality costs for Year 3. What is the increase in profitability resulting from the quality improvements made from Year 1 to Year 3?arrow_forward
- Muskogee Company had sales of 60,000,000 in 20x1. In 20x5, sales had increased to 75,000,000. A quality improvement program was implemented at the beginning of 20x1. Overall conformance quality was targeted for improvement. The quality costs for 20x1 and 20x5 follow. Assume any changes in quality costs are attributable to improvements in quality. Required: 1. Compute the quality cost-to-sales ratio for each year. Is this type of improvement possible? 2. Calculate the relative distribution of costs by category for 20x1. What do you think of the way costs are distributed? (A pie chart or bar graph may be of some help.) How do you think they will be distributed as the company approaches a zero-defects state? 3. Calculate the relative distribution of costs by category for 20x5. What do you think of the level and distribution of quality costs? (A pie chart or bar graph may be of some help.) Do you think further reductions are possible? 4. The quality manager for Muskogee indicated that the external failure costs reported are only the measured costs. He argued that the 20x5 external costs were much higher than those reported and that additional investment ought to be made in control costs. Discuss the validity of his viewpoint. 5. Suppose that the manager of Muskogee received a bonus equal to 10 percent of the quality cost savings each year. Do you think that gainsharing is a good or a bad idea? Discuss the risks of gainsharing.arrow_forwardThe controller of Emery, Inc. has computed quality costs as a percentage of sales for the past 5 years (20X1 was the first year the company implemented a quality improvement program). This information is as follows: Required: 1. Prepare a trend graph for total quality costs. Comment on what the graph has to say about the success of the quality improvement program. 2. Prepare a graph that shows the trend for each quality cost category. What does the graph have to say about the success of the quality improvement program? Does this graph supply more insight than the total cost trend graph does? 3. Prepare a graph that compares the trend in relative control costs versus relative failure costs. Comment on the significance of this trend.arrow_forwardAndresen Company had the following quality costs for the years ended June 30, 20X1 and 20X2: At the end of 20X1, management decided to increase its investment in control costs by 50% for each categorys items, with the expectation that failure costs would decrease by 20% for each item of the failure categories. Sales were 6,000,000 for both 20X1 and 20X2. Required: 1. Calculate the budgeted costs for 20X2, and prepare an interim quality performance report. 2. Comment on the significance of the report. How much progress has Andresen made?arrow_forward
- Ross Company implemented a quality improvement program and tracked the following for the five years: By cost category as a percentage of sales for the same period of time: Required: 1. Prepare a bar graph that reveals the trend in quality cost as a percentage of sales (time on the horizontal axis and percentages on the vertical). Comment on the message of the graph. 2. Prepare a bar graph for each cost category as a percentage of sales. What does this graph tell you? 3. What if management would like to have the trend in relative distribution of quality costs? Express this as a bar graph and comment on its significance.arrow_forwardNorris Company implemented a quality improvement program and tracked the following for the 5 years: By cost category of sales for the same period of time: Required: 1. Prepare a bar graph (hat reveals the trend in quality cost as a percentage of sales (time on horizontal axis and percentages on the vertical). Comment on the message of the graph. 2. Prepare a bar graph for each cost category as a percentage of sales. What does this graph tell you?arrow_forwardIn 20x4, Tru-Delite Frozen Desserts, Inc., instituted a quality improvement program. At the end of 20x5, the management of the corporation requested a report to show the amount saved by the measures taken during the year. The actual sales and quality costs for 20x4 and 20x5 are as follows: Tru-Delites management believes that quality costs can be reduced to 2.5 percent of sales within the next five years. At the end of 20x9, Tru-Delites sales are projected to grow to 750,000. The projected relative distribution of quality costs at the end of 20x9 is as follows: Required: 1. Profits increased by what amount due to quality improvements made in 20x5? 2. Prepare a long-range performance report that compares the quality costs incurred at the end of 20x5 with the quality cost structure expected at the end of 20x9. 3. Are the targeted costs in the year 20x9 all value-added costs? How would you interpret the variances if the targeted costs are value-added costs? 4. What would be the profit increase in 20x9 if the 2.5 percent performance standard is met in that year?arrow_forward
arrow_back_ios
SEE MORE QUESTIONS
arrow_forward_ios
Recommended textbooks for you
 Managerial Accounting: The Cornerstone of Busines...AccountingISBN:9781337115773Author:Maryanne M. Mowen, Don R. Hansen, Dan L. HeitgerPublisher:Cengage Learning
 Cornerstones of Cost Management (Cornerstones Ser...AccountingISBN:9781305970663Author:Don R. Hansen, Maryanne M. MowenPublisher:Cengage Learning
 Principles of Cost AccountingAccountingISBN:9781305087408Author:Edward J. Vanderbeck, Maria R. MitchellPublisher:Cengage Learning
 Managerial AccountingAccountingISBN:9781337912020Author:Carl Warren, Ph.d. Cma William B. TaylerPublisher:South-Western College Pub
 Principles of Accounting Volume 2AccountingISBN:9781947172609Author:OpenStaxPublisher:OpenStax College
Managerial Accounting: The Cornerstone of Busines...
Accounting
ISBN:9781337115773
Author:Maryanne M. Mowen, Don R. Hansen, Dan L. Heitger
Publisher:Cengage Learning
Cornerstones of Cost Management (Cornerstones Ser...
Accounting
ISBN:9781305970663
Author:Don R. Hansen, Maryanne M. Mowen
Publisher:Cengage Learning
Principles of Cost Accounting
Accounting
ISBN:9781305087408
Author:Edward J. Vanderbeck, Maria R. Mitchell
Publisher:Cengage Learning
Managerial Accounting
Accounting
ISBN:9781337912020
Author:Carl Warren, Ph.d. Cma William B. Tayler
Publisher:South-Western College Pub
Principles of Accounting Volume 2
Accounting
ISBN:9781947172609
Author:OpenStax
Publisher:OpenStax College
Inspection and Quality control in Manufacturing. What is quality inspection?; Author: Educationleaves;https://www.youtube.com/watch?v=Ey4MqC7Kp7g;License: Standard youtube license