
Concept explainers
Videos
(a)
To find: The mean and the median for each of the distribution.
(a)
Answer to Problem 13HP
Themean of the graph is 14 and the median is 13.
Explanation of Solution
Given:
The given graph is shown in Figure 1
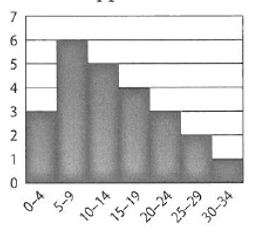
Figure 1
Calculation:
Consider the table from the graph shown in Figure 1
Table 1
| Class interval | Frequency | Class width |
| 0 to 4 | 3 | |
| 5 to 9 | 6 | 7 |
| 10 to 14 | 5 | 12 |
| 15 to 19 | 4 | 17 |
| 20 to 24 | 3 | 22 |
| 25 to 29 | 2 | 27 |
| 30 to 34 | 1 | 32 |
Thus, the mean from the above data is obtained as,
Consider the Table 2as,
| Class interval | Frequency | Class boundary | Cumulative frequency |
| 0 to 4 | 3 | -0.5 to 4.5 | 3 |
| 5 to 9 | 6 | 4.5 to 9.5 | 3+6=9 |
| 10 to 14 | 5 | 9.5 to 14.5 | 14 |
| 15 to 19 | 4 | 14.5 to 19.5 | 19 |
| 20 to 24 | 3 | 19.5 to 24.5 | 22 |
| 25 to 29 | 2 | 24.5 to 29.5 | 24 |
| 30 to 34 | 1 | 29..5 to 34.5 | 25 |
Obtain the mean class as,
The value
The formula for the median class is,
Then,
Thus, the approximate median of the graph is
(b)
To find: The mean and the median for each of the distribution.
(b)
Answer to Problem 13HP
The mean of the graph is
Explanation of Solution
Given:
The given graph is shown in Figure 1
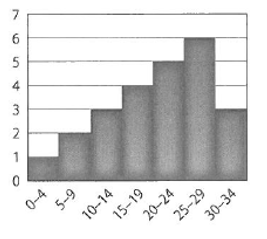
Figure 1
Calculation:
Consider the table from the graph shown in Figure 1
Table 1
| Class interval | Frequency | Class width |
| 0 to 4 | 1 | |
| 5 to 9 | 2 | 7 |
| 10 to 14 | 3 | 12 |
| 15 to 19 | 4 | 17 |
| 20 to 24 | 5 | 22 |
| 25 to 29 | 6 | 27 |
| 30 to 34 | 3 | 32 |
Thus, the mean from the above data is obtained as,
Consider the Table 2as,
| Class interval | Frequency | Class boundary | Cumulative frequency |
| 0 to 4 | 1 | -0.5 to 4.5 | 1 |
| 5 to 9 | 2 | 4.5 to 9.5 | 3 |
| 10 to 14 | 3 | 9.5 to 14.5 | 6 |
| 15 to 19 | 4 | 14.5 to 19.5 | 10 |
| 20 to 24 | 5 | 19.5 to 24.5 | 15 |
| 25 to 29 | 6 | 24.5 to 29.5 | 21 |
| 30 to 34 | 3 | 29..5 to 34.5 | 24 |
Obtain the mean class as,
The value
The formula for the median class is,
Then,
Thus, the approximate median of the graph is
(c)
To find: The mean and the median for each of the distribution.
(c)
Answer to Problem 13HP
The mean of the graph is
Explanation of Solution
Given:
The given graph is shown in Figure 1
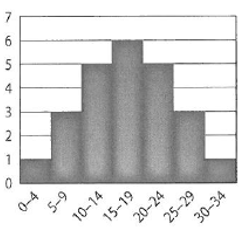
Figure 1
Calculation:
Consider the table from the graph shown in Figure 1
Table 1
| Class interval | Frequency | Class width |
| 0 to 4 | 1 | |
| 5 to 9 | 3 | 7 |
| 10 to 14 | 5 | 12 |
| 15 to 19 | 6 | 17 |
| 20 to 24 | 5 | 22 |
| 25 to 29 | 3 | 27 |
| 30 to 34 | 1 | 32 |
Thus, the mean from the above data is obtained as,
Consider the Table 2as,
| Class interval | Frequency | Class boundary | Cumulative frequency |
| 0 to 4 | 1 | -0.5 to 4.5 | 1 |
| 5 to 9 | 3 | 4.5 to 9.5 | 4 |
| 10 to 14 | 5 | 9.5 to 14.5 | 9 |
| 15 to 19 | 6 | 14.5 to 19.5 | 15 |
| 20 to 24 | 5 | 19.5 to 24.5 | 20 |
| 25 to 29 | 3 | 24.5 to 29.5 | 23 |
| 30 to 34 | 1 | 29..5 to 34.5 | 24 |
Obtain the mean class as,
The value
The formula for the median class is,
Then,
Thus, the approximate median of the graph is
Chapter 11 Solutions
Glencoe Algebra 2 Student Edition C2014
Additional Math Textbook Solutions
College Algebra (7th Edition)
Linear Algebra and Its Applications (5th Edition)
College Algebra
Essentials of Statistics (6th Edition)


 Algebra and Trigonometry (6th Edition)AlgebraISBN:9780134463216Author:Robert F. BlitzerPublisher:PEARSON
 Contemporary Abstract AlgebraAlgebraISBN:9781305657960Author:Joseph GallianPublisher:Cengage Learning
 Linear Algebra: A Modern IntroductionAlgebraISBN:9781285463247Author:David PoolePublisher:Cengage Learning
 Algebra And Trigonometry (11th Edition)AlgebraISBN:9780135163078Author:Michael SullivanPublisher:PEARSON
 Introduction to Linear Algebra, Fifth EditionAlgebraISBN:9780980232776Author:Gilbert StrangPublisher:Wellesley-Cambridge Press
 College Algebra (Collegiate Math)AlgebraISBN:9780077836344Author:Julie Miller, Donna GerkenPublisher:McGraw-Hill Education