
Concept explainers
Videos
a.
To create the histogram using graphing calculator and describe the shape of the distribution.
a.
Explanation of Solution
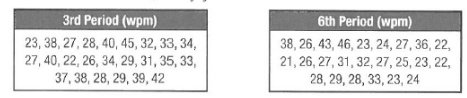
Given:
The typing speeds of the students in two classes is shown in the table-
Calculation:
Press
Press 2nd and, select
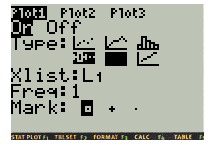
Press GRAPH key to trace the graph as shown in the display below;
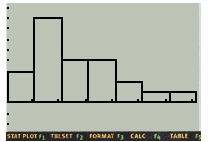
Since, the majority of the data is on the right and there is tail on the left, the distribution is negatively skewed.
b.
To find the mean and the standard deviation or the five-number summary.
b.
Explanation of Solution
Given:
The typing speeds of the students in two classes is shown in the table-
Calculation:
Press
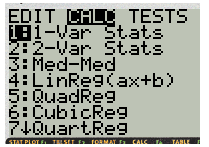
In the display screen, Press enter to get the value as shown in the display below;
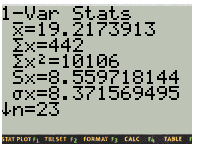
Therefore the mean
The standard deviation is
Press the arrow down of the display screen to find the median as shown below:
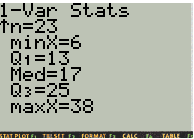
The median is
Chapter 11 Solutions
Glencoe Algebra 2 Student Edition C2014
Additional Math Textbook Solutions
PREALGEBRA
College Algebra
College Algebra (7th Edition)
Linear Algebra and Its Applications (5th Edition)
Calculus: Early Transcendentals (3rd Edition)


 Algebra and Trigonometry (6th Edition)AlgebraISBN:9780134463216Author:Robert F. BlitzerPublisher:PEARSON
 Contemporary Abstract AlgebraAlgebraISBN:9781305657960Author:Joseph GallianPublisher:Cengage Learning
 Linear Algebra: A Modern IntroductionAlgebraISBN:9781285463247Author:David PoolePublisher:Cengage Learning
 Algebra And Trigonometry (11th Edition)AlgebraISBN:9780135163078Author:Michael SullivanPublisher:PEARSON
 Introduction to Linear Algebra, Fifth EditionAlgebraISBN:9780980232776Author:Gilbert StrangPublisher:Wellesley-Cambridge Press
 College Algebra (Collegiate Math)AlgebraISBN:9780077836344Author:Julie Miller, Donna GerkenPublisher:McGraw-Hill Education