
Introduction to Statistics and Data Analysis
5th Edition
ISBN: 9781305445963
Author: PECK
Publisher: Cengage
expand_more
expand_more
format_list_bulleted
Videos
Textbook Question
Chapter 11.2, Problem 32E
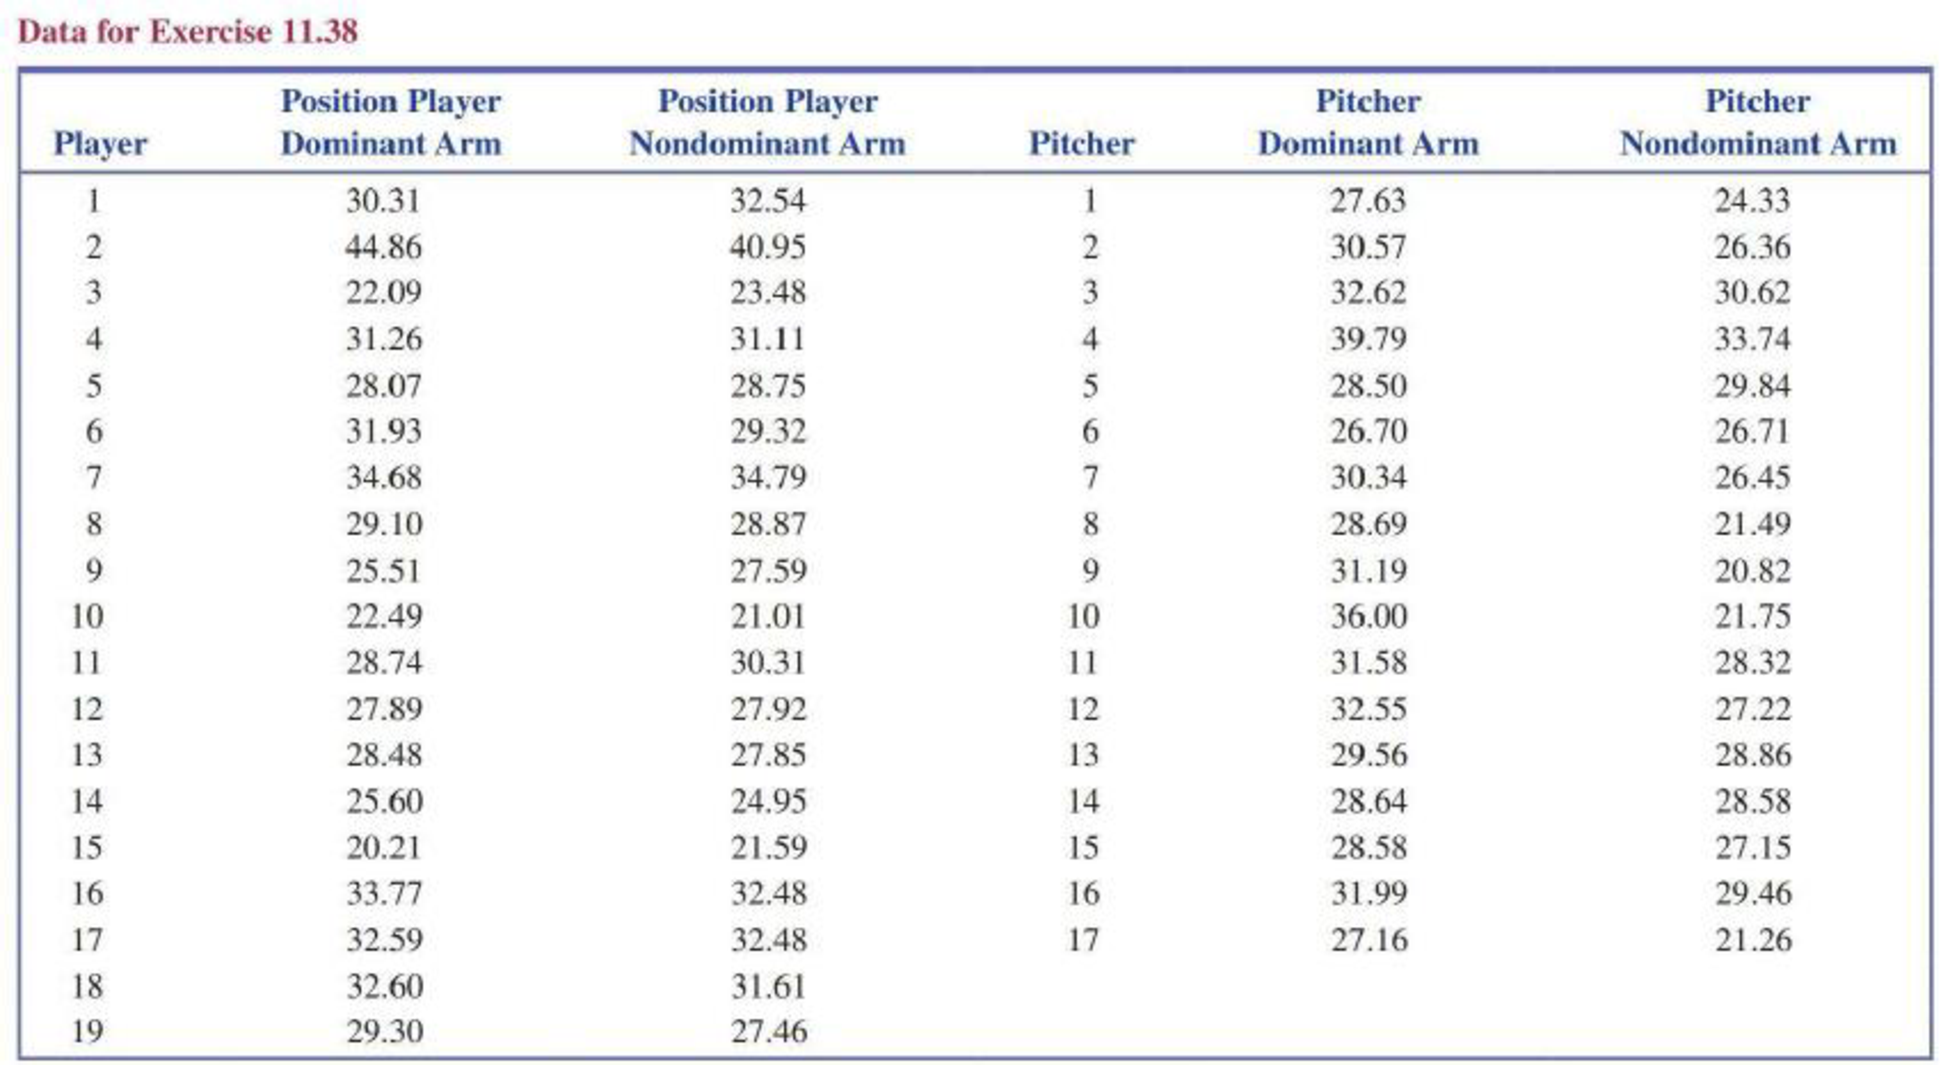
The paper “Quantitative Assessment of Glenohumeral Translation in Baseball Players” (American Journal of Sports Medicine [2004]: 1711–1715) considered various aspects of shoulder motion for a sample of pitchers and another sample of position players. The authors kindly supplied the data shown below on anteroposterior translation (mm), a measure of the extent of anterior and posterior motion, both for the dominant arm and the nondominant arm.
- a. Estimate the true average difference in translation between dominant and nondominant arms for pitchers using a 95% confidence interval.
- b. Estimate the true average difference in translation between dominant and nondominant arms for position players using a 95% confidence interval.
- c. The authors asserted that pitchers have greater difference in mean anteroposterior translation of their shoulders than do position players. Do you agree? Explain.
Expert Solution & Answer

Trending nowThis is a popular solution!

Students have asked these similar questions
A study of the relationship between age and various visual functions (such as acuity and depth perception) reported the following observations on the area of scleral lamina (mm²) from human optic nerve heads:
2.80 2.66 2.77 3.84 2.28 2.79 3.96 4.26 3.80
4.41 3.55 4.43 2.40 3.74 2.85 3.61 3.00
USE SALT
(a) Calculate Ex; and Ex₁².
2
ΣΧ; = 57.15
2
Exi = 29.70
✓ mm²
x mm 4
(b) Use the values calculated in part (a) to compute the sample variance s² and then the sample standard deviation s. (Round your answers to four decimal places.)
s² = 57.15
S = 0.7088
x mm
4
mm²
A study of the relationship between age and various visual functions (such as acuity and depth perception) reported the following observations on the area of scleral lamina
(mm2) from human optic nerve heads:
2.71 2.56 2.64 3.91 2.24 2.84 4.00 4.20 3.80
4.35 3.40 4.50 2.49 3.73 2.83 3.55 2.91
LAUSE SALT
(a) Calculate Ex, and Ex₁².
mm²
Σχιζ = |
(b) Use the values calculated in part (a) to compute the sample variance s² and then the sample standard deviation s. (Round your answers to four decimal places.)
s² =
mm4
mm²
S=
4
mm
A study of the relationship between age and various visual functions (such as acuity and depth perception) reported the following observations on the area of scleral lamina (mm2) from human optic nerve heads:
2.84
2.63
2.76
3.75
2.28
2.64
3.94
4.11
3.80
4.27
3.49
4.51
2.40
3.59
2.72
3.55
3.02
(a) Calculate Σxi and Σxi2.
Σxi
= ? mm2
Σxi2
= ? mm4
(b) Use the values calculated in part (a) to compute the sample variance s2 and then the sample standard deviation s. (Round your answers to four decimal places.)
s2
= ? mm4
s
= ? mm2
Chapter 11 Solutions
Introduction to Statistics and Data Analysis
Ch. 11.1 - Consider two populations for which 1 = 30, 1 = 2,...Ch. 11.1 - An individual can take either a scenic route to...Ch. 11.1 - Prob. 3ECh. 11.1 - Prob. 4ECh. 11.1 - The article Plugged In, but Tuned Out (USA TODAY,...Ch. 11.1 - Prob. 6ECh. 11.1 - Prob. 7ECh. 11.1 - The paper If Its Hard to Read, Its Hard to Do...Ch. 11.1 - Is injecting medical cement effective in reducing...Ch. 11.1 - Prob. 10E
Ch. 11.1 - Prob. 11ECh. 11.1 - The paper Mood Food: Chocolate and Depressive...Ch. 11.1 - Prob. 13ECh. 11.1 - Example 11.1 looked at a study comparing students...Ch. 11.1 - Prob. 15ECh. 11.1 - Prob. 16ECh. 11.1 - A newspaper story headline reads Gender Plays Part...Ch. 11.1 - Prob. 18ECh. 11.1 - Fumonisins are environmental toxins produced by a...Ch. 11.1 - A researcher at the Medical College of Virginia...Ch. 11.1 - Do certain behaviors result in a severe drain on...Ch. 11.2 - Suppose that you were interested in investigating...Ch. 11.2 - Head movement evaluations are important because...Ch. 11.2 - To determine if chocolate milk was as effective as...Ch. 11.2 - The humorous paper Will Humans Swim Faster or...Ch. 11.2 - The study described in the paper Marketing Actions...Ch. 11.2 - Prob. 27ECh. 11.2 - The paper Less Air Pollution Leads to Rapid...Ch. 11.2 - The paper The Truth About Lying in Online Dating...Ch. 11.2 - Prob. 30ECh. 11.2 - Prob. 31ECh. 11.2 - The paper Quantitative Assessment of Glenohumeral...Ch. 11.2 - Two proposed computer mouse designs were compared...Ch. 11.2 - Prob. 34ECh. 11.2 - Prob. 35ECh. 11.2 - The authors of the paper Ultrasound Techniques...Ch. 11.3 - Some people seem to believe that you can fix...Ch. 11.3 - Prob. 38ECh. 11.3 - After the 2010 earthquake in Haiti, many...Ch. 11.3 - Prob. 40ECh. 11.3 - The report Audience Insights: Communicating to...Ch. 11.3 - Prob. 42ECh. 11.3 - Prob. 43ECh. 11.3 - Prob. 44ECh. 11.3 - The article Fish Oil Staves Off Schizophrenia (USA...Ch. 11.3 - The report Young People Living on the Edge...Ch. 11.3 - Prob. 47ECh. 11.3 - Prob. 48ECh. 11.3 - Prob. 49ECh. 11.3 - Prob. 50ECh. 11.3 - Prob. 51ECh. 11.3 - The article Spray Flu Vaccine May Work Better Than...Ch. 11.3 - Prob. 53ECh. 11.3 - The following quote is from the article Canadians...Ch. 11.3 - Prob. 55ECh. 11.3 - Women diagnosed with breast cancer whose tumors...Ch. 11.3 - Prob. 57ECh. 11.4 - The paper The Psychological Consequences of Money...Ch. 11.4 - An experiment to determine if an online...Ch. 11.4 - The paper Ready or Not? Criteria for Marriage...Ch. 11 - Prob. 61CRCh. 11 - Prob. 62CRCh. 11 - A deficiency of the trace element selenium in the...Ch. 11 - Prob. 64CRCh. 11 - Prob. 65CRCh. 11 - In a study of a proposed treatment for diabetes...Ch. 11 - When a surgeon repairs injuries, sutures (stitched...Ch. 11 - Prob. 68CRCh. 11 - In a study of memory recall, eight students from a...Ch. 11 - As part of a study to determine the effects of...Ch. 11 - Prob. 71CRCh. 11 - Prob. 72CRCh. 11 - The article Truth and DARE: Tracking Drug...Ch. 11 - The article Softball Sliding Injuries (American...Ch. 11 - Prob. 75CRCh. 11 - Wayne Gretzky was one of ice hockeys most prolific...Ch. 11 - Heres one to sink your teeth into: The authors of...Ch. 11 - Prob. 78CRCh. 11 - Dentists make many people nervous. To see whether...Ch. 11 - Prob. 80CRCh. 11 - Prob. 81CRCh. 11 - Both surface soil and subsoil specimens were taken...
Knowledge Booster


Learn more about
Need a deep-dive on the concept behind this application? Look no further. Learn more about this topic, statistics and related others by exploring similar questions and additional content below.Similar questions
- Previous studies have shown that playing video games can increase visual perception abilities on tasks presented in the gaming zone of the screen (within 5 degrees of the center). A graduate student is interested in whether playing video games increases peripheral visual perception abilities or decreases attention to peripheral regions because of focus on the gaming zone. For her study, she selects a random sample of 64 adults. The subjects complete a difficult spatial perception task to determine baseline levels of their abilities. After playing an action video game (a first-person combat simulation) for 1 hour a day over 10 days, they complete the difficult perception task for a second time. Before playing the action video game, the mean score in their accuracy on the spatial task was 0.42. After playing the action video game, the mean score was -0.08. The mean of the differences between each person's pre- and postscores was 0.5, with a standard deviation of the differences equal to…arrow_forwardA study of the relationship between age and various visual functions (such as acuity and depth perception) reported the following observations on the area of scleral lamina (mm2) from human optic nerve heads: 2.79 2.66 2.80 3.92 2.28 2.81 4.02 4.16 3.95 4.26 3.51 4.61 2.37 3.66 2.72 3.64 2.96 (a) Calculate Σxi and Σxi2. (Round Σxi2 to two decimal places.) Σxi = mm2 Σxi2 = mm4 (b) Use the values calculated in part (a) to compute the sample variance s2 and then the sample standard deviation s. (Round your answers to three decimal places.) s2 = mm4 s = mm2arrow_forwardPrevious studies have shown that playing video games can increase visual perception abilities on tasks presented in the gaming zone of the screen (within 5 degrees of the center). A graduate student is interested in whether playing video games increases peripheral visual perception abilities or decreases attention to peripheral regions because of focus on the gaming zone. For her study, she selects a random sample of 64 adults. The subjects complete a difficult spatial perception task to determine baseline levels of their abilities. After playing an action video game (a first-person combat simulation) for 1 hour a day over 10 days, they complete the difficult perception task for a second time. Before playing the action video game, the mean score in their accuracy on the spatial task was 0.42. After playing the action video game, the mean score was -0.08. The mean of the differences between each person's pre- and postscores was 0.5, with a standard deviation of the differences equal to…arrow_forward
- Previous studies have shown that playing video games can increase visual perception abilities on tasks presented in the gaming zone of the screen (within 5 degrees of the center). A graduate student is interested in whether playing video games increases peripheral visual perception abilities or decreases attention to peripheral regions because of focus on the gaming zone. For her study, she selects a random sample of 64 adults. The subjects complete a difficult spatial perception task to determine baseline levels of their abilities. After playing an action video game (a first-person combat simulation) for 1 hour a day over 10 days, they complete the difficult perception task for a second time. Before playing the action video game, the mean Score in their accuracy on the spatial task was 0.42. After playing the action video game, the mean score was -0.08. The mean of the differences between each person's pre- and postscores was 0.5, with a standard deviation of the differences equal to…arrow_forwardPrevious studies have shown that playing video games can increase visual perception abilities on tasks presented in the gaming zone of the screen (within 5 degrees of the center). A graduate student is interested in whether playing video games increases peripheral visual perception abilities or decreases attention to peripheral regions because of focus on the gaming zone. For her study, she selects a random sample of 64 adults. The subjects complete a difficult spatial perception task to determine baseline levels of their abilities. After playing an action video game (a first-person combat simulation) for 1 hour a day over 10 days, they complete the difficult perception task for a second time. Before playing the action video game, the mean score in their accuracy on the spatial task was 0.42. After playing the action video game, the mean score was -0.08. The mean of the differences between each person's pre- and postscores was 0.5, with a standard deviation of the differences equal to…arrow_forwardAccording to the Center for Disease Control (CDC) during the 2018-2019 season the percent of Americans 18 and older who had a flu shot was 45.3%. We did a random sample of 500 Americans and found that 200 out of the 500 had a flu shot. Is there enough evidence at the 5% level that 45.3% or less of Americans 18 or older had a flu shot? Find the SE, z score, and p-value: a) SE = sqrt(0.40(1-.40)/500) = 0.0219, Z-score = (0.453 – 0.40)/0.0219 = 2.42, p-value = 0.87 b) SE = sqrt(0.453(1-.453)/500) = 0.223, Z-score = (0.40 – 0.453)/0.223 = -0.24, p-value = 0.4052 c) SE = sqrt(0.453(1-.453)/500) = 0.0223, Z-score = (0.453 – 0.40)/0.0223 = 2.38, p-value = 0.9913 d) SE = sqrt(0.453(1-.453)/500) = 0.0223, Z-score = (0.40 – 0.453)/0.0223 = -2.38, p-value = 0.0087arrow_forward
- 54. Grip is applied to produce normal surface forces that compress the object being gripped. Examples include two people shaking hands, or a nurse squeezing a patient's forearm to stop bleeding. The article "Investigation of Grip Force, Normal Force, Contact Area, Hand Size, and Handle Size for Cylindrical Handles" (Human Factors, 2008: 734-744) included the following data on grip strength (N) for a sample of 42 individuals: 16 18 18 26 33 41 54 56 66 68 87 91 95 98 106 109 111 118 127 127 135 145 147 149 151 168 172 183 189 190 200 210 220 229 230 233 238 244 259 294 329 403 a. Construct a stem-and-leaf display based on repeat- ing each stem value twice, and comment on inter- esting features. b. Determine the values of the fourths and the fourthspread. c. Construct a boxplot based on the five-number sum- mary, and comment on its features. 5arrow_forwardScores on an accounting exam ranged from 42 to 89, with quartiles Q1 = 53.75, Q2 = 77.5, and Q3 = 83.25. (a) Select the correct box plot for the given data. BoxPlot A BoxPlot B BoxPlot C A. BoxPlot A B. BoxPlot B C. BoxPlot C (b) Describe its shape (skewed left, symmetric, skewed right). A. The distribution is skewed right. B. The distribution is symmetric. C. The distribution is skewed left.arrow_forwardA researcher was interested in whether head worn displays were better than tablet displays for assisting rst responders with their tasks. He had 17 paramedics use either a head worn display (n = 9) or a tablet display (n = 8) during a simulated medical emergency. Each paramedic’s subjective workload score was measured out of 20 (where 20 indicated the highest workload). The data did not conform to the assumptions of a parametric test. a. What is the rank sum for the Head worn display group? a. 80 b. 73 c. 71 d. 82 b. What is the WS? a. 71 b. 80 c. 73 d. 82 c. What critical value of WS do you compare your obtained value to? a. 53 b. 54 c. 49 d. 51arrow_forward
- Grip is applied to produce normal surface forces thatcompress the object being gripped. Examples includetwo people shaking hands, or a nurse squeezing apatient’s forearm to stop bleeding. The article“Investigation of Grip Force, Normal Force, ContactArea, Hand Size, and Handle Size for CylindricalHandles” (Human Factors, 2008: 734–744) includedthe following data on grip strength (N) for a sample of 42individuals:16 18 18 26 33 41 54 56 66 68 87 91 9598 106 109 111 118 127 127 135 145 147 149 151 168172 183 189 190 200 210 220 229 230 233 238 244 259294 329 403a. Construct a stem-and-leaf display based on repeatingeach stem value twice, and comment on interestingfeatures.b. Determine the values of the fourths and thefourthspread.c. Construct a boxplot based on the five-number summary,and comment on its features.d. How large or small does an observation have to be toqualify as an outlier? An extreme outlier? Are thereany outliers?e. By how much could the observation 403, currentlythe…arrow_forwardWild irises are beautiful flowers found throughout the United States, Canada, and northern Europe. This problem concerns the length of the sepal (leaf-like part covering the flower) of different species of wild iris. Data are based on information taken from an article by R. A. Fisher in Annals of Eugenics (Vol. 7, part 2, pp. 179 -188). Measurements of sepal length in centimeters from random samples of Iris setosa (I), Iris versicolor (II), and Iris virginica (III) are as follows below. I II III 5.7 5.1 6.5 4.7 6.2 5.1 4.7 6.6 4.7 5.8 4.9 7.5 4.6 5.2 5.3 5.3 6.2 6.2 5.4 5.8 6.4 (b) Find SSTOT, SSBET, and SSW and check that SSTOT = SSBET + SSW. (Use 3 decimal places.) SSTOT = SSBET = SSW = Find d.f.BET, d.f.W, MSBET, and MSW. (Use 4 decimal places for MSBET, and MSW.) dfBET = dfW = MSBET = MSW = Find the value of the sample F statistic. (Use 2 decimal places.)What are the degrees of freedom? (numerator) (denominator)arrow_forwardThe regression line y= 3 +2x has been fitted to the data points (4, 8). (2, 5), and (1, 2). The variance of the error will be: O a) 15 Ob) 7 Oc) 22 Od) 8arrow_forward
arrow_back_ios
SEE MORE QUESTIONS
arrow_forward_ios
Recommended textbooks for you
 MATLAB: An Introduction with ApplicationsStatisticsISBN:9781119256830Author:Amos GilatPublisher:John Wiley & Sons Inc
 Probability and Statistics for Engineering and th...StatisticsISBN:9781305251809Author:Jay L. DevorePublisher:Cengage Learning
 Statistics for The Behavioral Sciences (MindTap C...StatisticsISBN:9781305504912Author:Frederick J Gravetter, Larry B. WallnauPublisher:Cengage Learning
 Elementary Statistics: Picturing the World (7th E...StatisticsISBN:9780134683416Author:Ron Larson, Betsy FarberPublisher:PEARSON
 The Basic Practice of StatisticsStatisticsISBN:9781319042578Author:David S. Moore, William I. Notz, Michael A. FlignerPublisher:W. H. Freeman
 Introduction to the Practice of StatisticsStatisticsISBN:9781319013387Author:David S. Moore, George P. McCabe, Bruce A. CraigPublisher:W. H. Freeman
MATLAB: An Introduction with Applications
Statistics
ISBN:9781119256830
Author:Amos Gilat
Publisher:John Wiley & Sons Inc
Probability and Statistics for Engineering and th...
Statistics
ISBN:9781305251809
Author:Jay L. Devore
Publisher:Cengage Learning
Statistics for The Behavioral Sciences (MindTap C...
Statistics
ISBN:9781305504912
Author:Frederick J Gravetter, Larry B. Wallnau
Publisher:Cengage Learning
Elementary Statistics: Picturing the World (7th E...
Statistics
ISBN:9780134683416
Author:Ron Larson, Betsy Farber
Publisher:PEARSON
The Basic Practice of Statistics
Statistics
ISBN:9781319042578
Author:David S. Moore, William I. Notz, Michael A. Fligner
Publisher:W. H. Freeman
Introduction to the Practice of Statistics
Statistics
ISBN:9781319013387
Author:David S. Moore, George P. McCabe, Bruce A. Craig
Publisher:W. H. Freeman
Introduction to experimental design and analysis of variance (ANOVA); Author: Dr. Bharatendra Rai;https://www.youtube.com/watch?v=vSFo1MwLoxU;License: Standard YouTube License, CC-BY