
Concept explainers
Videos
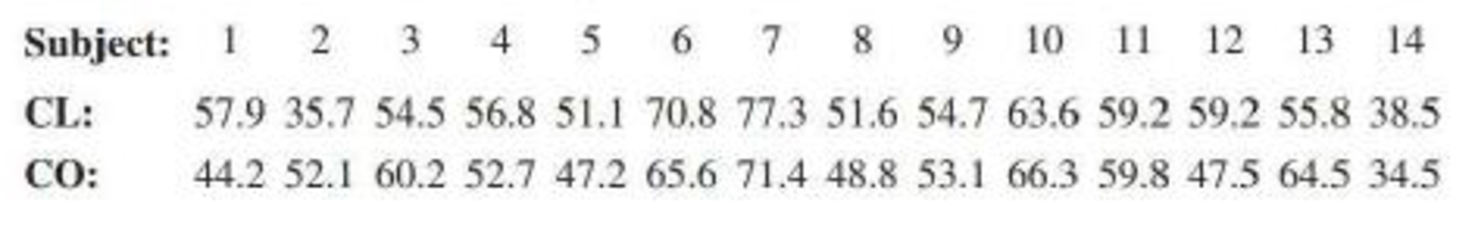
Head movement evaluations are important because disabled individuals may be able to operate communications aids using head motion. The paper “Constancy of Head Turning Recorded in Healthy Young Humans” (Journal of Biomedical Engineering [2008]: 428–436) reported the accompanying data on neck rotation (in degrees) for 14 subjects both in the clockwise direction (CL) and in the counterclockwise direction (CO). For purposes of this exercise, you can assume that the 14 subjects are representative of the population of adult Americans. Based on these data, is it reasonable to conclude that

Trending nowThis is a popular solution!

Chapter 11 Solutions
INTRODUCTION TO STATISTICS & DATA ANALYS


- Using all 1991 birth records in the computerized national birth certificate registry compiled by the National Center for Health Statistics (NCHS), statisticians Traci Clemons and Marcello Pagano found that the birth weights of babies in the United States are not symmetric ("Are babies normal?" The American Statistician, Nov 1999, 53:4). However, they also found that when infants born outside of the "typical" 37-43 weeks and infants born to mothers with a history of diabetes are excluded, the birth weights of the remaining infants do follow a Normal model with mean μ = 3432 g and standard deviation σ = 482 g. The following questions refer to infants born from 37 to 43 weeks whose mothers did not have a history of diabetes.Compute the z-score of an infant who weighs 2903 g. (Round your answer to two decimal places.)−1.10Correct Approximately what fraction of infants would you expect to have birth weights between 3060 g and 4410 g? (Express your answer as a decimal, not a percent, and…arrow_forwardA sample of men and women who had passed their driver's test either the first time or the second time were surveyed, with the following results: Results of the driving testGender First time Second timeMen 126 211Women 135 178a) Do these data suggest that there is a relationship between gender and the passing of their driver’s test from which the present sample was drawn? Let alpha=.05arrow_forwardA paper investigated the driving behavior of teenagers by observing their vehicles as they left a high school parking lot and then again at a site approximately 1 2 mile from the school. Assume that it is reasonable to regard the teen drivers in this study as representative of the population of teen drivers. MaleDriver FemaleDriver 1.3 -0.3 1.3 0.6 0.9 1.1 2.1 0.7 0.7 1.1 1.3 1.2 3 0.1 1.3 0.9 0.6 0.5 2.1 0.5 (a) Use a .01 level of significance for any hypothesis tests. Data consistent with summary quantities appearing in the paper are given in the table. The measurements represent the difference between the observed vehicle speed and the posted speed limit (in miles per hour) for a sample of male teenage drivers and a sample of female teenage drivers. (Use ?males − ?females. Round your test statistic to two decimal places. Round your degrees of freedom down to the nearest whole number. Round your p-value to three decimal places.) t = df =…arrow_forward
- A paper investigated the driving behavior of teenagers by observing their vehicles as they left a high school parking lot and then again at a site approximately 1 2 mile from the school. Assume that it is reasonable to regard the teen drivers in this study as representative of the population of teen drivers. MaleDriver FemaleDriver 1.4 -0.2 1.2 0.5 0.9 1.1 2.1 0.7 0.7 1.1 1.3 1.2 3 0.1 1.3 0.9 0.6 0.5 2.1 0.5 (a) Use a .01 level of significance for any hypothesis tests. Data consistent with summary quantities appearing in the paper are given in the table. The measurements represent the difference between the observed vehicle speed and the posted speed limit (in miles per hour) for a sample of male teenage drivers and a sample of female teenage drivers. (Use ?males − ?females. Round your test statistic to two decimal places. Round your degrees of freedom down to the nearest whole number. Round your p-value to three decimal places.) t = df =…arrow_forwardMR In Dave Eggers’ novel The Circle, a mysteri-ous technology company has developed a strangely data-driven work environment in which employees are assigned a performance score that seems to be the product of factors in their social activities and environment, such as the extent of their engagement in work community and the number of times they post on the company’s social media site. Using the fictional data below, compute r and r2 for each com-bination of two variables from this novel and test the correlations for their significance. Write a paragraph interpreting the relationships between these vari-ables, and what they might mean for the companyarrow_forwardA developmental psychologist is studying bonding between healthy newborn babies and immediate family members. He wants to know if one-week-old infants use smell to recognize their fathers. To investigate, he selects a random sample of one-week-old infants. Each infant is presented with a garment worn by his or her father and two garments worn by unrelated men. The psychologist observes which garment each of the infants orients toward. The resulting data are summarized in the following table that shows the number of infants who oriented toward each of the three garments. What is are the degrees of freedom for this experiment? 4 3 1 2arrow_forward
- Which of the independent variables retains the strongest association with the number of children a respondent has when all other variables in the model are controlled? What is that association? Which has the weakest when other variables are controlled?arrow_forwardA group of high-risk automobile drivers (with three moving violations in one year) are required, according to random assignment, either to attend a traffic school or to perform supervised volunteer work. During the subsequent five-year period, these same drivers were cited for the following number of moving violations: NUMBER OF MOVING VIOLATIONS TRAFFIC SCHOOL VOLUNTEER WORK 0 26 0 7 15 4 9 1 7 1 0 14 2 6 23 10 7 8 Why might the Mann–Whitney U test be preferred to the t test for these data? Use U to test the null hypothesis at the .05 level of significance. Specify the approximate p-value for this test result.arrow_forwardA researcher is interested in testing the relationship between smoking and BMI (kg/m2) in adults aged 30-45. In order to test this association, the researcher divides smoking into currently more than a pack a day, currently less than a pack a day, and never smokers. The following table represents the BMIs for each participant enrolled by their respective smoking category. Current Smoker (≥1pack/day) Current Smoker (<1 pack/day Never Smoked 26.7 29.4 22.1 29.4 28.6 30.4 24.3 27.4 21.3 28.4 23.2 26.4 21.6 20.1 19.7 27.4 20.6 19.8 26.8 19.7 21.6 36.4 19.6 22.3 31.5 21.6 24.3 27.4 21.5 *Continue as though all assumptions for ANOVA are met. A) Calculate the MSW and MSB for the data represented above. B) Carry out a formal test for a one-way analysis of variance among the groups and interpret your results.arrow_forward
- Given the data in the following table for wave-solderingnonconformities, determine if there are any differencesbetween the two processes. Based on variousa levels, would you recommend a change to the proposedprocess?arrow_forwardA paper investigated the driving behavior of teenagers by observing their vehicles as they left a high school parking lot and then again at a site approximately 1 2 mile from the school. Assume that it is reasonable to regard the teen drivers in this study as representative of the population of teen drivers. Amount by Which Speed Limit Was Exceeded MaleDriver FemaleDriver 1.3 -0.1 1.3 0.4 0.9 1.1 2.1 0.7 0.7 1.1 1.3 1.2 3 0.1 1.3 0.9 0.6 0.5 2.1 0.5 (a) Use a .01 level of significance for any hypothesis tests. Data consistent with summary quantities appearing in the paper are given in the table. The measurements represent the difference between the observed vehicle speed and the posted speed limit (in miles per hour) for a sample of male teenage drivers and a sample of female teenage drivers. (Use μmales − μfemales.Round your test statistic to two decimal places. Round your degrees of freedom down to the nearest whole number. Round your p-value to…arrow_forwardExercises 5–8 refer to the study of an association between which ear is used for cell phone calls and whether the subject is left-handed or right-handed. The study is reported in “Hemispheric Dominance and Cell Phone Use,” by Seidman et al., JAMA Otolaryngology—Head & Neck Surgery, Vol. 139, No. 5. The study began with a survey e-mailed to 5000 people belonging to an otology online group, and 717 surveys were returned. (Otology relates to the ear and hearing.) Sampling Method What type of sampling best describes the way in which the 717 subjects were chosen: simple random sample, systematic sample, convenience sample, stratified sample, cluster sample? Does the method of sampling appear to adversely affect the quality of the results?arrow_forward
 MATLAB: An Introduction with ApplicationsStatisticsISBN:9781119256830Author:Amos GilatPublisher:John Wiley & Sons Inc
 Probability and Statistics for Engineering and th...StatisticsISBN:9781305251809Author:Jay L. DevorePublisher:Cengage Learning
 Statistics for The Behavioral Sciences (MindTap C...StatisticsISBN:9781305504912Author:Frederick J Gravetter, Larry B. WallnauPublisher:Cengage Learning
 Elementary Statistics: Picturing the World (7th E...StatisticsISBN:9780134683416Author:Ron Larson, Betsy FarberPublisher:PEARSON
 The Basic Practice of StatisticsStatisticsISBN:9781319042578Author:David S. Moore, William I. Notz, Michael A. FlignerPublisher:W. H. Freeman
 Introduction to the Practice of StatisticsStatisticsISBN:9781319013387Author:David S. Moore, George P. McCabe, Bruce A. CraigPublisher:W. H. Freeman