
Toidentify:The quartiles by graphing a box and whisker plot of the data.

Quartiles for June:
Quartiles for July:
Quartiles for August:
Given information:
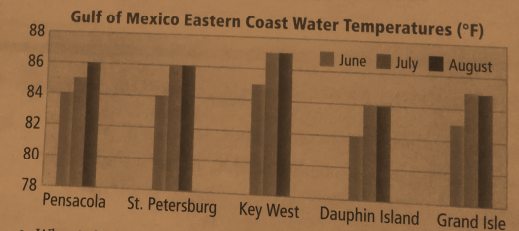
The given graph is shown below:
Explanation:
Consider the given information.
Make the table by using the graph.
| June | 84 | 84 | 85 | 82 | 83 |
| July | 85 | 86 | 87 | 84 | 85 |
| August | 86 | 86 | 87 | 84 | 85 |
Since the total number of data set is 5 which is odd number so median is the exactly middle value.
Find Quartiles for June:
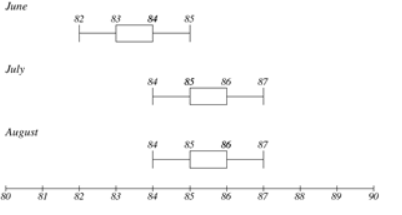
Sorted the data as shown:
82, 83, 84, 84, 85
Thus, median is 84.
First quartile
The third
Find Quartiles for July:
Sorted the data as shown:
84, 85, 85, 86, 87
Thus, median is 85.
First quartile
The third
Find Quartiles for August:
Sorted the data as shown:
84, 85, 86, 86, 87
Thus, median is 86.
First quartile
The third
The required graph is shown below:
Chapter 11 Solutions
High School Math 2015 Common Core Algebra 2 Student Edition Grades 10/11

 Algebra and Trigonometry (6th Edition)AlgebraISBN:9780134463216Author:Robert F. BlitzerPublisher:PEARSON
 Contemporary Abstract AlgebraAlgebraISBN:9781305657960Author:Joseph GallianPublisher:Cengage Learning
 Linear Algebra: A Modern IntroductionAlgebraISBN:9781285463247Author:David PoolePublisher:Cengage Learning
 Algebra And Trigonometry (11th Edition)AlgebraISBN:9780135163078Author:Michael SullivanPublisher:PEARSON
 Introduction to Linear Algebra, Fifth EditionAlgebraISBN:9780980232776Author:Gilbert StrangPublisher:Wellesley-Cambridge Press
 College Algebra (Collegiate Math)AlgebraISBN:9780077836344Author:Julie Miller, Donna GerkenPublisher:McGraw-Hill Education