Financial Accounting (12th Edition) (What's New in Accounting)
12th Edition
ISBN: 9780134725987
Author: C. William Thomas, Wendy M. Tietz, Walter T. Harrison Jr.
Publisher: PEARSON
expand_more
expand_more
format_list_bulleted
Videos
Textbook Question
Chapter 12, Problem 12.61AP
LO 2, 4, 5
(Learning Objectives 2, 4, 5: Analyze trends; calculate and interpret ratios; evaluate earnings quality)
Selected data from Tompkin Furniture, Inc., follows.
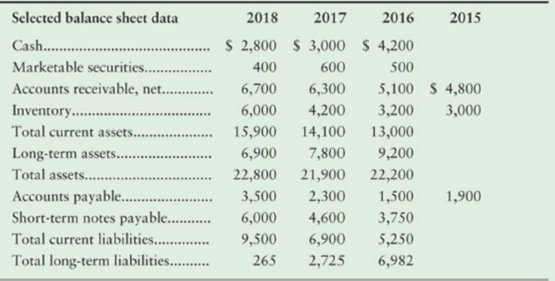
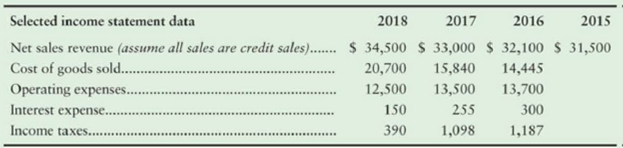
Industry averages have been gathered for several ratios.
| Furniture industry averages | |
| 2.3 | |
| Quick ratio.................................. | 1.0 |
| Days′ inventory outstanding......... | 80.0 |
| Days′ sales outstanding................ | 60.0 |
| Days′ payable outstanding........... | 32.0 |
| Debt ratio..................................... | 62% |
| Times-interest-earned ratio.......... | 12.0 |
| Gross margin percentage.............. | 51% |
| Operating income percentage....... | 10% |
Requirements
1. Perform a trend analysis on Tompkin’s sales revenue, inventory, and receivables over the past three years, using 2015 as the base. Is the trend in each of these areas favorable or unfavorable for the company?
2. Using the industry averages as benchmarks, analyze Tompkin’s performance over the past three years in the following areas:
- a. Liquidity
- b. Turnover
- c. Overall debt payment ability
- d. Profitability
3. Evaluate Tompkin’s quality of earnings. Are there any red flags in your analysis? Explain.
Expert Solution & Answer
Want to see the full answer?
Check out a sample textbook solution
Students have asked these similar questions
Please take a look below at the two companies' financial ratios. Use the material your learned in the chapter to try and identify the industries these two companies operate in. You are going to be graded on the quality of your analysis and arguments (e.g. this ratio indicates that... and that ratio indicates the other,... and taken together these ratios indicate that.... (and so forth)) :
Company A
Company B
P/E Ratio: 30
Price/Sales: 6
Price/Book Value of Equity: 7.5
Profit Margin: 20%
Operating Margin: 25%
Return on Assets (ROA): 6%
Return On Equity (ROE): 25%
Current Ratio: 3
P/E Ratio: 17
Price/Sales: 0.6
Price/Book Value of Equity: 3
Profit Margin: 3%
Operating Margin: 5%
Return on Assets (ROA): 7%
Return On Equity (ROE): 15%
Current Ratio: 1
In a minimum of 175 words
Imagine that you’ve been asked to explain 1 of the major accounting ratios to a group of high school students who have no background in business or accounting but are eager to learn. Choose 1 of the following ratios and describe how you would explain it in your own words, using a specific example:
current ratio
asset turnover
profit margin on sales
Chapter 12 Solutions
Financial Accounting (12th Edition) (What's New in Accounting)
Ch. 12 - Prob. 1QCCh. 12 - Prob. 2QCCh. 12 - Prob. 3QCCh. 12 - Prob. 4QCCh. 12 - Expressing accounts receivable as a percentage of...Ch. 12 - Kincaid Company reported the following data (in...Ch. 12 - Prob. 7QCCh. 12 - Ratios that measure liquidity include all of the...Ch. 12 - Verba Corporation has an inventory turnover of 15...Ch. 12 - The measure of a companys ability to collect cash...
Ch. 12 - A ratio that measures a companys profitability is...Ch. 12 - Prob. 12QCCh. 12 - Prob. 13QCCh. 12 - Prob. 14QCCh. 12 - Prob. 12.1ECCh. 12 - Prob. 12.1SCh. 12 - Prob. 12.2SCh. 12 - Prob. 12.3SCh. 12 - Prob. 12.4SCh. 12 - Prob. 12.5SCh. 12 - (Learning Objective 4: Evaluate a companys quick...Ch. 12 - Prob. 12.7SCh. 12 - (Learning Objective 4: Measure ability to pay...Ch. 12 - (Learning Objective 4: Measure profitability using...Ch. 12 - Prob. 12.10SCh. 12 - (Learning Objective 4: Use ratio data to...Ch. 12 - Prob. 12.12SCh. 12 - (Learning Objective 4: Analyze a company based on...Ch. 12 - Prob. 12.14SCh. 12 - Prob. 12.15SCh. 12 - Prob. 12.16AECh. 12 - Prob. 12.17AECh. 12 - Prob. 12.18AECh. 12 - Prob. 12.19AECh. 12 - Prob. 12.20AECh. 12 - Prob. 12.21AECh. 12 - Prob. 12.22AECh. 12 - Prob. 12.23AECh. 12 - Prob. 12.24AECh. 12 - Prob. 12.25AECh. 12 - Prob. 12.26AECh. 12 - Prob. 12.27BECh. 12 - Prob. 12.28BECh. 12 - Prob. 12.29BECh. 12 - Prob. 12.30BECh. 12 - Prob. 12.31BECh. 12 - LO 4 (Learning Objective 4: Calculate ratios;...Ch. 12 - Prob. 12.33BECh. 12 - Prob. 12.34BECh. 12 - Prob. 12.35BECh. 12 - Prob. 12.36BECh. 12 - Prob. 12.37BECh. 12 - Prob. 12.38QCh. 12 - Prob. 12.39QCh. 12 - Prob. 12.40QCh. 12 - Prob. 12.41QCh. 12 - Prob. 12.42QCh. 12 - Prob. 12.43QCh. 12 - Prob. 12.44QCh. 12 - Use the Orlando Medical Corporation financial...Ch. 12 - Prob. 12.46QCh. 12 - Use the Orlando Medical Corporation financial...Ch. 12 - Prob. 12.48QCh. 12 - Prob. 12.49QCh. 12 - Prob. 12.50QCh. 12 - Prob. 12.51QCh. 12 - Prob. 12.52QCh. 12 - Prob. 12.53QCh. 12 - Prob. 12.54QCh. 12 - Prob. 12.55QCh. 12 - LO 1, 2, 4 (Learning Objectives 1, 2, 4: Calculate...Ch. 12 - Prob. 12.57APCh. 12 - Prob. 12.58APCh. 12 - LO 4 (Learning Objective 4: Use ratios to evaluate...Ch. 12 - Prob. 12.60APCh. 12 - LO 2, 4, 5 (Learning Objectives 2, 4, 5: Analyze...Ch. 12 - Group B LO 1, 2, 4 (Learning Objectives 1, 2, 4:...Ch. 12 - Prob. 12.63BPCh. 12 - Prob. 12.64BPCh. 12 - LO 4 (Learning Objective 4: Use ratios to evaluate...Ch. 12 - Prob. 12.66BPCh. 12 - LO 2, 4, 5 (Learning Objectives 2, 4, 5: Analyze...Ch. 12 - Prob. 12.68CEPCh. 12 - Prob. 12.69CEPCh. 12 - (Learning Objectives 2, 3.4: Use trend...Ch. 12 - (Learning Objectives 4, 5: Calculate and analyze...Ch. 12 - Prob. 12.72DCCh. 12 - Prob. 12.73DCCh. 12 - Prob. 12.74EICCh. 12 - Focus on Financials Apple Inc. LO 1, 2, 3, 4, 5...Ch. 12 - Comprehensive Financial Statement Analysis Project...
Knowledge Booster


Learn more about
Need a deep-dive on the concept behind this application? Look no further. Learn more about this topic, accounting and related others by exploring similar questions and additional content below.Similar questions
- Compare and contrast the four categories of financial ratios we discussed in class. Discuss how the business owners and potential investors could benefit from these ratios. What are clear indicators of success vs. poor operations?arrow_forwardCAB Co. (CAB), a publicly accountable company specializing in children’s clothing, activities, and toys, wishes to benchmark its financial results against industry leaders for the current fiscal year. CAB’s chief executive officer feels that benchmarking CAB’s results will help identify its strengths and weaknesses. Below is some information on CAB compared to the industry average: Ratio CAB Co. Industry average Current ratio 1.02 1.05 Gross margin 30% 33% Debt-to-equity 0.6 0.5 Return on equity 23% 20% Accounts receivable days 23 31 Earnings per share 2.03 2.84 Inventory days 24 26 Quick ratio 1.2 1.3 Required: Evaluate CAB’s liquidity compared to the industry average, using two Evaluate CAB’s profitability compared to the industry average, using three Evaluate CAB’s solvency compared to the industry average, using one Evaluate how well CAB manages its assets compared to the industry…arrow_forwardAy 1. Using your financial analysis of Gap Clothing company, Refer to the Annual Reports located in the Class Resources. You will use information in the Form 10-K to complete this assignment. Using the correct formulas and a separate tab for each analysis, calculate the following ratios using Microsoft Excel: Three liquidity ratios for the past 2 years Three solvency ratios for the past 2 years Three profitability ratios for the past 2 yearsarrow_forward
- In analysis earnings quality. Earnings quality refers to the reliability of the financial statements presented and whether it reflects the current business environment.Required:In 300 words, discuss the determinants of earnings qualityarrow_forwardYou are a financial consultant. You are hired by a manufacturing company to assess its performance Based on financial ratios. Your task is to come up with the following: (1) financial analysis using financial ratios on liquidity, solvency or stability, and profitability; (2) trend analysis, both vertical and horizontal; and (3) comparative financial statements. The analysis should be benchmarked with competitors. Prepare a report indicating your comments on the financial health and performance of the company (as benchmarked with competitors) using the following liquidity ratios: (1) current ratio, (2) receivable turnover, (3) inventory turnover, and (4) quick ratio. Give your insights into the relative solvency or stability of the company (as benchmarked with the competitors) using the following ratios: (1) debt ratio, (2) times interest earned ratio, and (3) debt - equity ratio, Also, assess the relative profitability of the company (as benchmarked with competitors) using the…arrow_forwardCAB Co. (CAB), a publicly accountable company specializing in children’s clothing, activities, and toys, wishes to benchmark its financial results against industry leaders for the current fiscal year. CAB’s chief executive officer feels that benchmarking CAB’s results will help identify its strengths and weaknesses.Below is some information on CAB compared to the industry average:Ratio CAB Co. Industry averageCurrent ratio 1.02 1.05Gross margin 30% 33%Debt-to-equity 0.6 0.5Return on equity 23% 20%Accounts receivable days 23 31Earnings per share 2.03 2.84Inventory days 24 26Quick ratio 1.2 1.3Required:a) Evaluate CAB’s liquidity compared to the industry average, using two ratios.b) Evaluate CAB’s profitability compared to the industry average, using three ratios.c) Evaluate CAB’s solvency compared to the industry average, using one ratio.d) Evaluate how well CAB manages its assets compared to the industry average, using two ratios.arrow_forward
arrow_back_ios
arrow_forward_ios
Recommended textbooks for you

 Survey of Accounting (Accounting I)AccountingISBN:9781305961883Author:Carl WarrenPublisher:Cengage Learning
Survey of Accounting (Accounting I)
Accounting
ISBN:9781305961883
Author:Carl Warren
Publisher:Cengage Learning
How To Analyze an Income Statement; Author: Daniel Pronk;https://www.youtube.com/watch?v=uVHGgSXtQmE;License: Standard Youtube License