
Videos
Section 1:
To find: The pooled two-sample t-statistic for provided scenario.
Section 1:
Answer to Problem 46E
Solution: The pooled two-sample t- statistic is 4.17.
Explanation of Solution
Given: The data provided in exercise 7.68 is
Group |
Sample size |
Mean |
Sample Standard Deviation |
LC |
|||
LF |
Calculation: The two-sample pooled t-statistic is calculated by the formula is
The pooled sample standard deviation is calculated as
Therefore, substituting all values in the above mentioned formula, the value of required t- statistic is
Section 2:
To find: An ANOVA table.
Section 2:
Answer to Problem 46E
Solution: The ANOVA table is
Sources |
Degree of freedom |
Sum of square |
Mean sum of square |
F- ratio |
Groups |
1 |
12737.01 |
12737.01 |
17.4 |
Error |
63 |
46128.07 |
732.19 |
|
Total |
64 |
The analysis show that the means are not equal.
Explanation of Solution
Calculation: The null and alternative hypotheses are set as below:
The formulation of ANOVA table will be by the formula provided below:
Sources |
Degree of freedom |
Sum of square |
Mean sum of square |
F |
Groups |
||||
Error |
||||
Total |
Here, N is the total number of samples, I is the number of cases,
By the data provided, the total number of groups is
And,
The degree of freedom for groups is calculated as
The degree of freedom of error is calculated as
Total degree of freedom is
The pooled mean is calculated as
The sum of squares for groups is calculated as
The sum of squares of error is calculated as
The mean sum of square of groups is calculated as
The mean sum of square of error is calculated as
The F-ratio is calculated as
Now the ANOVA table is
Sources |
Degree of freedom |
Sum of square |
Mean sum of square |
F- ratio |
Groups |
1 |
12737.01 |
12737.01 |
17.4 |
Error |
63 |
46128.07 |
732.19 |
|
Total |
64 |
The critical value for the test is calculated using the Excel. The screenshot of the used formula is shown below:
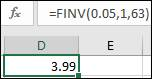
The critical value is obtained as 3.99, which is smaller than the calculated value. So, the null hypothesis will be rejected at 5% significance level.
Section 3:
To explain: Whether
Section 3:
Answer to Problem 46E
Solution: Yes, the F- statistic is equal to square of t- statistic.
Explanation of Solution
The calculation can be done as
Therefore, it is verified that
Want to see more full solutions like this?
Chapter 12 Solutions
Introduction to the Practice of Statistics


 MATLAB: An Introduction with ApplicationsStatisticsISBN:9781119256830Author:Amos GilatPublisher:John Wiley & Sons Inc
 Probability and Statistics for Engineering and th...StatisticsISBN:9781305251809Author:Jay L. DevorePublisher:Cengage Learning
 Statistics for The Behavioral Sciences (MindTap C...StatisticsISBN:9781305504912Author:Frederick J Gravetter, Larry B. WallnauPublisher:Cengage Learning
 Elementary Statistics: Picturing the World (7th E...StatisticsISBN:9780134683416Author:Ron Larson, Betsy FarberPublisher:PEARSON
 The Basic Practice of StatisticsStatisticsISBN:9781319042578Author:David S. Moore, William I. Notz, Michael A. FlignerPublisher:W. H. Freeman
 Introduction to the Practice of StatisticsStatisticsISBN:9781319013387Author:David S. Moore, George P. McCabe, Bruce A. CraigPublisher:W. H. Freeman