
Concept explainers
Videos
(a)
To find: The null and alternative hypotheses for the part (a) and part (b) of referred Exercise 12.35.
(a)
Answer to Problem 36E
Solution: The null and alternative hypotheses for part (a) are given below:
The null and alternative hypotheses for part (b) are given below:
Explanation of Solution
Calculation: For part (a), the null hypothesis represents that there is no difference between average score of brown eyes and average score of other two eye colors, while the alternative hypothesis assumes that there is significant difference between average score of brown eyes and average score of other two eye colors. That is,
The null hypothesis would be
Against the alternative hypothesis:
For part (b), the null hypothesis assumes that there is no difference there is no difference between average score of gaze eyes and average score of other three eye colors, that is, blue, green, and brown when the model is looking at you versus model looking downwards, while the alternative hypothesis assumes that that there is significant difference between average score of gaze eyes and average score of other three eye colors, that is, blue, green, and brown when the model is looking at you versus model looking down wards. That is,
The null hypothesis would be
Against the alternative hypothesis:
Interpretation: Null hypothesis for both the parts represents the zero difference. Alternative hypothesis for part (a) represents that there is some difference between the average score of brown eyes and average score of blue and green eyes and alternative hypothesis for part (b) represents that there is some difference between the
(b)
To find: The values for the sample contrasts
(b)
Answer to Problem 36E
Solution: The value of sample contrast
Explanation of Solution
Calculation: The sample contrast can be calculated by using the formula given below:
Sample contrast for the part (a) of referred Exercise 12.35 can be calculated given below:
where the coefficients are taken from the solution of part (a) of exercise 35, which are given below:
So, the contrast is calculated as shown below:
Sample contrast for the part (b) of referred Exercise 12.35 can be calculated as given below:
where the coefficients are taken from the solution of part (b) of exercise 35, which are given below:
So, the contrast is calculated as shown below:
(c)
To find: The standard errors for the contrast expression of part (a) and part (b) of referred Exercise 12.35.
(c)
Answer to Problem 36E
Solution: The standard error for the contrast
Explanation of Solution
Calculation: Standard error for any contrast can be calculated by using the formula mentioned below:
where
Standard error for the first contrast can be calculated by using the formula given below:
Pooled standard deviation for part (a) of exercise 35 can be calculated by using the formula mentioned below:
Further standard error can be calculated as
Standard error for the first contrast of part (b) of the problem 35 can be calculated by using the formula given below:
Pooled standard deviation for part (b) of exercise 35 can be calculated by using the formula mentioned below:
Further standard error can be calculated as
Interpretation: Therefore, it can be concluded that for the first contrast, the estimated value of standard deviation is 0.315 and for the second contrast, the estimated value of standard deviation is 0.287.
(d)
To find: The test statistics and the P-values for the two tests.
(d)
Answer to Problem 36E
Solution: For the first contrast, the test statistics and the P-value is 0.619 and 0.268, respectively. For the second contrast, the test statistic and the P-value is 1.67 and 0.048, respectively.
Explanation of Solution
Calculation: The test statistic can be calculated by using following formula, which is mentioned below:
The test statistic for the first contrast can be calculated by the formula given below:
The total sample size for first contrast is 181. There are three groups, which are represented by k.
The degree of freedom for contrast can be obtained as shown below:
The P-value can also be calculated by the software Microsoft Excel by using the following command:
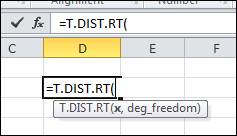
Insert the values of x and degree of freedom which are 0.619 and 178, respectively and press enter. The output is shown below in the snapshot:
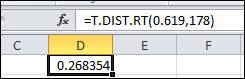
Hence, the P- value is obtained as 0.268, which is greater than the significance level 0.05.
The test statistic for the second contrast can be calculated by the formula given below:
The total sample size for second contrast is 222. There are four groups, which are represented by k.
The degree of freedom for second contrast can be obtained as shown below:
The P-value can also be calculated by the software Microsoft Excel by using the following command:
Insert the values of x and degree of freedom which are 1.67 and 218, respectively and press enter. The output is shown below in the snapshot:
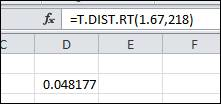
Hence, the P- value is obtained as 0.048, which is less than the significance level 0.05.
Interpretation: For the first contrast, the result is not significant but for the second contrast the result is significant.
(e)
To find: The 95% confidence interval for both the contrast.
(e)
Answer to Problem 36E
Solution: The 95% interval for the first contrast
Explanation of Solution
Calculation: The confidence interval for the first contrast
The confidence interval for the second contrast
Interpretation: Therefore, it can be concluded that for the first contrast, 95% of the time mean value lies between the values 0 and 0.39. Also, for the second contrast, 95% of the time mean value lies between the values 0.001 and 0.959.
Want to see more full solutions like this?
Chapter 12 Solutions
Introduction to the Practice of Statistics


 MATLAB: An Introduction with ApplicationsStatisticsISBN:9781119256830Author:Amos GilatPublisher:John Wiley & Sons Inc
 Probability and Statistics for Engineering and th...StatisticsISBN:9781305251809Author:Jay L. DevorePublisher:Cengage Learning
 Statistics for The Behavioral Sciences (MindTap C...StatisticsISBN:9781305504912Author:Frederick J Gravetter, Larry B. WallnauPublisher:Cengage Learning
 Elementary Statistics: Picturing the World (7th E...StatisticsISBN:9780134683416Author:Ron Larson, Betsy FarberPublisher:PEARSON
 The Basic Practice of StatisticsStatisticsISBN:9781319042578Author:David S. Moore, William I. Notz, Michael A. FlignerPublisher:W. H. Freeman
 Introduction to the Practice of StatisticsStatisticsISBN:9781319013387Author:David S. Moore, George P. McCabe, Bruce A. CraigPublisher:W. H. Freeman