
Concept explainers
Videos
(a)
To find: The summary from the data.
(a)
Answer to Problem 64E
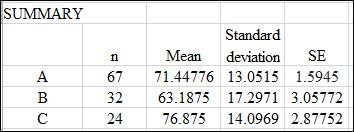
Solution: The summary from the data is as shown below:
Explanation of Solution
Calculation: To draw the inference from the data, use Excel. Steps are provided below:
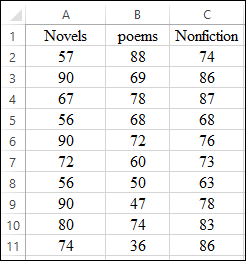
Step 1: Open Excel sheet and write the value for three treatments. The screenshot is shown below:
Step 2: The sample size for “Novels” can be obtained by using the formula

The sample size for “Poems” can be obtained by using the formula

The sample size for “Nonfiction” can be obtained by using the formula

Step 3: The average value for “Novels” can be obtained by using the formula

The average value for “Poems” can be obtained by using the formula

The average value for “Nonfiction” can be obtained by using the formula

Step 4: The standard deviation for “Novels” can be obtained by using the formula

The standard deviation for “Poems” can be obtained by using the formula

The standard deviation for “Nonfiction” can be obtained by using the formula

Step 5: The standard error for “Novels” can be obtained by using the formula

The standard error for “Poems” can be obtained by using the formula

The standard error for “Nonfiction” can be obtained by using the formula

The result is obtained.
The screenshot of the summary of results is shown below:
(b)
Necessary assumption to carry out ANOVA test.
(b)
Answer to Problem 64E
Solution: All the distribution are approximately normal and pooling of standard deviation is applicable.
Explanation of Solution
(c)
To test: The ANOVA model.
(c)
Answer to Problem 64E
Solution: The required ANOVA model is obtained as follows:
Here, the F value is greater than the F critical value. Hence, the null hypothesis can be rejected significantly.
Explanation of Solution
Calculation: Single factor ANOVA model is performed by following these steps:
Step 1: Open Excel sheet and write the value for three treatments. The screenshot is shown below:
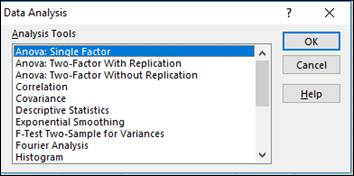
Step 3: Data > Data Analysis > OK. The screenshot is shown below:

Step 4: Select ANOVA: Single Factor > OK. The screenshot is shown below:
Step 5: Select input
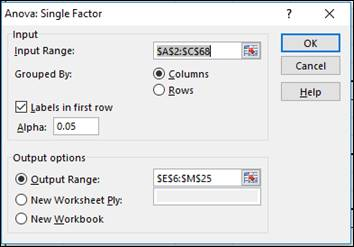
The model is obtained. The screenshot is shown below:
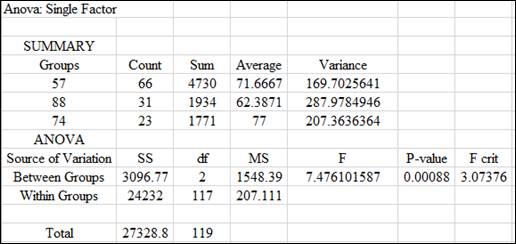
Conclusion: Here, the F value is greater than the F critical. Hence, null hypothesis can be rejected significantly.
(d)
To test: The contrast to compare the poets with the writers.
(d)
Answer to Problem 64E
Solution: The P value is
Explanation of Solution
A contrast (c) is defined as a combination of population means.
where
The null hypothesis,
where
The null hypothesis is tested to compare novelists with the nonfiction writers. The following steps are followed with reference to part (c) on excel to test the null hypothesis:
Step 1: Contrast c is calculated as follows:
Step 2: The pooled standard deviation is obtained as follows:
Step 3: Standard error of contrast is obtained as follows:
Step 4: The resultant t statistic can be calculated as follows:
(e)
To test: A contrast to compare the novelists with the nonfiction writers.
(e)
Answer to Problem 64E
Solution: The p- value is
Explanation of Solution
Step 1: Contrast c is calculated as follows:
Step 2: The pooled standard deviation is obtained as follows:
Step 3: Standard error of contrast can be calculated as follows:
Step 4: The resultant t statistic can be calculated as follows:
Conclusion: The p- value is
(f)
To test: The multiple comparison t test.
(f)
Answer to Problem 64E
Solution: The poem’s mean is significantly different from other means.
Explanation of Solution
Calculation:
Multiple comparison t-test is performed by following these steps:
Step 1: Open Excel sheet and write the value for three treatments. The screenshot is shown below:
Step 2: Data > Data Analysis > OK. The screenshot is shown below:

Step 3: Select t-test: Two-Sample Assuming Equal Variances > OK. The screenshot is shown below:
Step 4: Select input range > OK. The screenshot is shown below:
Step 5: Repeat step 5 to compare low dose versus high dose and control versus high dose.
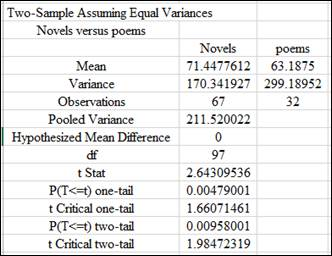
The result for comparison of novels versus poems is obtained as follows:
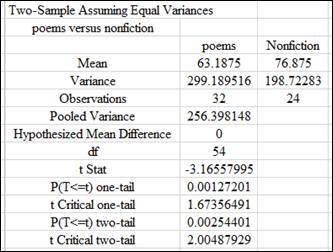
The result for comparison of poems versus nonfiction is obtained as follows:
The result for comparison of novels versus nonfiction is obtained as follows:
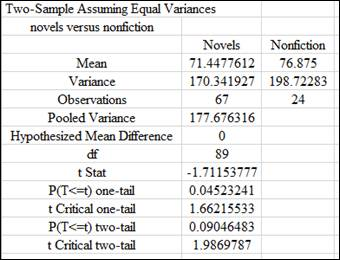
Conclusion: From the above comparison, the P value for two-tail for poems versus novels and poems versus nonfiction is less than 0.05 at 5% significance level. Hence, poem’s mean is significantly different from other means.
Want to see more full solutions like this?
Chapter 12 Solutions
Introduction to the Practice of Statistics


 MATLAB: An Introduction with ApplicationsStatisticsISBN:9781119256830Author:Amos GilatPublisher:John Wiley & Sons Inc
 Probability and Statistics for Engineering and th...StatisticsISBN:9781305251809Author:Jay L. DevorePublisher:Cengage Learning
 Statistics for The Behavioral Sciences (MindTap C...StatisticsISBN:9781305504912Author:Frederick J Gravetter, Larry B. WallnauPublisher:Cengage Learning
 Elementary Statistics: Picturing the World (7th E...StatisticsISBN:9780134683416Author:Ron Larson, Betsy FarberPublisher:PEARSON
 The Basic Practice of StatisticsStatisticsISBN:9781319042578Author:David S. Moore, William I. Notz, Michael A. FlignerPublisher:W. H. Freeman
 Introduction to the Practice of StatisticsStatisticsISBN:9781319013387Author:David S. Moore, George P. McCabe, Bruce A. CraigPublisher:W. H. Freeman