
Videos
(a)
To find: The P-value to conclude about the ANOVA model.
(a)
Answer to Problem 80E
Solution: The P-value is obtained as 0.000, which indicates that the mean age of the five different stores are different.
Explanation of Solution
Given: The data on the sample size, mean, and standard deviation of customers of five different stores are provided in the Exercise 12.6, which is shown in the below table.
Store |
Sample size |
Mean |
Sample Standard Deviation |
A |
|||
B |
|||
C |
|||
D |
|||
E |
Calculation: The null and alternative hypothesis of the provided is set as below:
The formulation of ANOVA table will be by the formula provided below:
Sources |
Degree of freedom |
Sum of square |
Mean sum of square |
F |
Groups |
||||
Error |
||||
Total |
Here, N is the total number of samples, I is the number of cases,
By the data provided, the number of groups, total number of groups is:
And,
The degrees of freedom for groups are calculated as:
The degrees of freedom of error are calculated as:
Total degrees of freedom are:
The pooled mean is calculated as:
The sum of squares for groups is calculated as:
The sum of squares of error is calculated:
The Mean Sum of Square of Groups is calculated as:
The Mean Sum of Square of Error is calculated as:
The F-ratio is calculated as:
Now the ANOVA table is:
Sources |
Degree of freedom |
Sum of square |
Mean sum of square |
F- ratio |
Groups |
4 |
11240 |
2810 |
27.93 |
Error |
245 |
24647 |
100.6 |
|
Total |
249 |
The
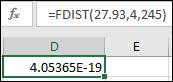
The obtained P-value is approximately 0.000, which is less than the significance level 0.05. So, the null hypothesis is rejected in the provided scenario.
Interpretation: The mean age of the customers at different coffee houses are different.
(b)
To test: The pairwise comparison using LSD method.
(b)
Answer to Problem 80E
Solution: The significant difference between the mean ages of the different coffee houses except the mean age of the store A and store E.
Explanation of Solution
Given: The data on the sample size, mean, and standard deviation of customers of five different stores are provided in the Exercise 12.6, which is shown in the below table.
Store |
Sample size |
Mean |
Sample Standard Deviation |
A |
|||
B |
|||
C |
|||
D |
|||
E |
Calculation: The value of the test statistic for LSD method is obtained through the below mentioned formula:
Where
The required calculation is shown in the below table.
ith Condition |
jth Condition |
Test statistic |
Store A |
Store B |
|
Store C |
||
Store D |
4.985 |
|
Store E |
1.496 |
|
Store B |
Store A |
4.985 |
Store C |
2.991 |
|
Store D |
9.970 |
|
Store E |
6.481 |
|
Store C |
Store A |
1.994 |
Store B |
||
Store C |
6.979 |
|
Store D |
3.490 |
|
Store D |
Store A |
|
Store B |
||
Store C |
||
Store E |
||
Store E |
Store A |
|
Store B |
||
Store C |
||
Store D |
3.490 |
The critical value for the test is obtained from the Table D in the textbook. In the table, there is no value available for 245 degrees of freedom. So, the value corresponding to the 1000 degrees of freedom is considered corresponding to
From the obtained result, it can be determined that a significant difference is present between some of the pairs of means. The only pair of means where the difference is not significant is the means of store A and store E. There is significant difference present between the other pairs of means.
Conclusion: The significant difference between the mean ages of the different coffee houses except the mean age of the store A and store E.
Want to see more full solutions like this?
Chapter 12 Solutions
Introduction to the Practice of Statistics


 MATLAB: An Introduction with ApplicationsStatisticsISBN:9781119256830Author:Amos GilatPublisher:John Wiley & Sons Inc
 Probability and Statistics for Engineering and th...StatisticsISBN:9781305251809Author:Jay L. DevorePublisher:Cengage Learning
 Statistics for The Behavioral Sciences (MindTap C...StatisticsISBN:9781305504912Author:Frederick J Gravetter, Larry B. WallnauPublisher:Cengage Learning
 Elementary Statistics: Picturing the World (7th E...StatisticsISBN:9780134683416Author:Ron Larson, Betsy FarberPublisher:PEARSON
 The Basic Practice of StatisticsStatisticsISBN:9781319042578Author:David S. Moore, William I. Notz, Michael A. FlignerPublisher:W. H. Freeman
 Introduction to the Practice of StatisticsStatisticsISBN:9781319013387Author:David S. Moore, George P. McCabe, Bruce A. CraigPublisher:W. H. Freeman