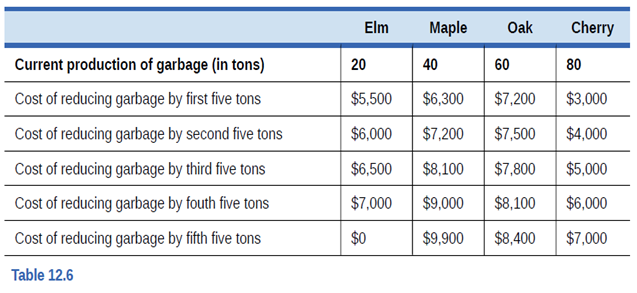
Four films called Elm, Maple, Oak, and (Shelly, produce wooden chairs. However, they also produce a great deal of garbage (a mixture of glue, varnish, sandpaper, and wood scraps). The first row of Table 12.6 shows the total amount of garbage (in tons) that each film currently produces. The other rows of the table show the cost of reducing garbage produced by the first five tons, the second five tons, and so on. First, calculate the cost of requiring each firm to reduce the weight of its garbage by one-fourth. Now, imagine that the government issues marketable permits for the current level of garbage, but the permits will shrink the weight of allowable garbage for each film by one-fourth. What will be the result of this alternative approach to reducing pollution?

Trending nowThis is a popular solution!

Chapter 12 Solutions
Principles of Economics 2e
Additional Business Textbook Solutions
Operations Management: Processes and Supply Chains (12th Edition) (What's New in Operations Management)
Horngren's Financial & Managerial Accounting, The Financial Chapters (Book & Access Card)
Corporate Finance (4th Edition) (Pearson Series in Finance) - Standalone book
Intermediate Accounting (2nd Edition)
MARKETING:REAL PEOPLE,REAL CHOICES
Gitman: Principl Manageri Finance_15 (15th Edition) (What's New in Finance)
- Environmental Economicsarrow_forwardEnvironmental Economicsarrow_forward1. The current price for a barrel of oil is $28. Assume the marginal extraction cost per barrel is $8 and the interest rate is 4 percent per year. a. According to the standard Hotelling model for a nonrenewable resource, what is the forecasted price for next year? b. How would your forecast change (qualitatively) if the demand for oil increased before next year?arrow_forward
- • What are the 5 positive and 5 negative attitudes a salesperson has? What are the best way to improve those negative attitudes? • What is the another concise definition of Salesmanship? • As a Watson's salesperson in the Philippines what are they're: - earning opportunities? - chances of promotion and career growth? - rewards and awards? - incentives and fringe benefits? - employment requirements?arrow_forwardWhere in the Victoria, BC is the most logging occurring? Include relative and absolute locationsarrow_forwardIn Foresty , What do most clear cut locations have in common with each other? Do they occur along the shorelines of lakes and rivers? Near major highways? Are they near cities or far from people?arrow_forward
- How sustainable is the forestry industry in BC in your opinion? Not at all, somewhat, very and explain your reasoning.arrow_forwardIn a paragraph, no bullet, points please answer the question and follow the instructions. Give only the solution: Use the Feynman technique throughout. Assume that you’re explaining the answer to someone who doesn’t know the topic at all. 6.Draw a standard Commercial Bank Balance Sheet and briefly explain each of the main components.arrow_forwardC1 The following model can be used to study whether campaign expenditures affect election outcomes: voteA = 0 + B₁ log(expendA) + ẞ₂ log(expendB) + ẞ3 prtystrA + u, where voteA is the percentage of the vote received by Candidate A, expendA and expend are campaign expenditures by Candidates A and B, and prtystrA is a measure of party strength for Candidate A (the percentage of the most recent presidential vote that went to A's party). == (i) (ii) (iii) (iv) What is the interpretation of B₁? In terms of the parameters, state the null hypothesis that a 1% increase in A's expenditures is offset by a 1% increase in B's expenditures. Estimate the given model using the data in VOTE1.DTA and report the results in usual form. Do A's expenditures affect the outcome? What about B's expenditures? Can you use these results to test the hypothesis in part (ii)? Estimate a model that directly gives the t statistic for testing the hypothesis in part (ii). What do you conclude? (Use a two-sided…arrow_forward
- In a paragraph, no bullet, points please answer the question and follow the instructions. Give only the solution: Use the Feynman technique throughout. Assume that you’re explaining the answer to someone who doesn’t know the topic at all. 10. What is Tinbergen’s constraint? Explain its importance in regard to US monetary policy.arrow_forwardIn a paragraph, no bullet, points please answer the question and follow the instructions. Give only the solution: Use the Feynman technique throughout. Assume that you’re explaining the answer to someone who doesn’t know the topic at all. 8. How does monetary policy supposedly translate into changes in AD?arrow_forwardIn a paragraph, no bullet, points please answer the question and follow the instructions. Give only the solution: Use the Feynman technique throughout. Assume that you’re explaining the answer to someone who doesn’t know the topic at all. 2. Carefully explain either Keynes’ “cookie jar” motive for holding money or the “saw-toothed model’s” motive for holding a safety stock.arrow_forward

 Microeconomics: Principles & PolicyEconomicsISBN:9781337794992Author:William J. Baumol, Alan S. Blinder, John L. SolowPublisher:Cengage Learning
 Economics (MindTap Course List)EconomicsISBN:9781337617383Author:Roger A. ArnoldPublisher:Cengage Learning


