
Principles of Economics 2e
2nd Edition
ISBN: 9781947172364
Author: Steven A. Greenlaw; David Shapiro
Publisher: OpenStax
expand_more
expand_more
format_list_bulleted
Videos
Textbook Question
Chapter 12, Problem 4SCQ
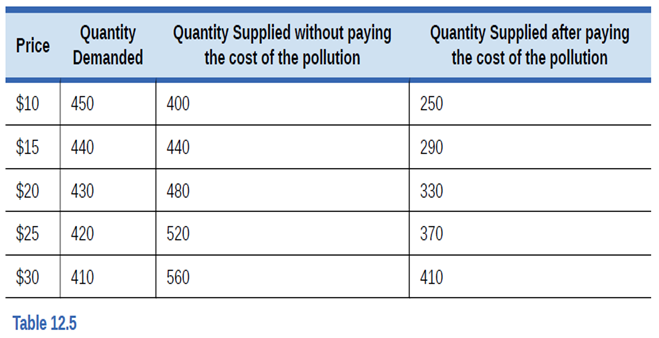
Table 12.5 provides the
Expert Solution & Answer

Trending nowThis is a popular solution!

Students have asked these similar questions
The table below shows the supply and demand conditions for a furniture factory that pollutes the air. The third column (Qs1) represents a
supply curve without accounting for the social cost of pollution. The fourth column (Qs2) represents the supply curve when the firm is
required to account for the social cost of pollution.
Price
QD
Qs1
Qs2
$10
450
400
250
$15
440
440
290
$25
430
480
330
$30
420
520
370
$35
410
560
410
Answer the following:
a) What is the negative externality in this situation?
b) Identify the equilibrium price and equilibrium quantity when we account only for private costs.
c) Identify the equilibrium price and equilibrium quantity when we account for the social costs.
d) How does accounting for the externality affect the equilibrium price and quantity? JUSTIFY your answer!
The primary source of air pollution in the small town of Smokey, Nevada is a nearby steel mill. The local environmental agency has decided that the mill needs to reduce its emissions because the town's
population is located directly downwind from it. Currently the agency is considering three different approaches to reducing pollution from the mill: a technology standard, an emission standard and an
emission tax.
Why might the owner of the mill prefer an emission standard to a technology standard that would produce the same level of emissions?
a
Because with emission standards the polluter is more flexible in selecting the technology that will minimize her abatement cost
Ob. Because polluters usually try to stick to their existing technology
O C. Because it has been proven to be easier to implement
O d. Because polluters, as all producers are suspicious about new technologies
Hand written solutions are strictly prohibited
Chapter 12 Solutions
Principles of Economics 2e
Ch. 12 - Identify the following situations as an example of...Ch. 12 - Identify whether the market supply curve will...Ch. 12 - For each of your answers to Exercise 12.2, will...Ch. 12 - Table 12.5 provides the supply and demand...Ch. 12 - Consider two approaches to reducing emissions of...Ch. 12 - Classify the following pollution-control policies...Ch. 12 - An emissions tax on a quantity of emissions from a...Ch. 12 - Four films called Elm, Maple, Oak, and (Shelly,...Ch. 12 - The rows in Table 12.7 show three market-oriented...Ch. 12 - Suppose a city releases 16 million gallons of raw...
Ch. 12 - The state of Colorado requires oil and gas...Ch. 12 - Consider the case of global environmental problems...Ch. 12 - A country called Sherwood is very heavily covered...Ch. 12 - What is an externality?Ch. 12 - Give an example of a positive externality and an...Ch. 12 - What is the difference between private costs and...Ch. 12 - In a market without environmental regulations,...Ch. 12 - What is command-and-control environmental...Ch. 12 - What are the three problems that economists have...Ch. 12 - What is a pollution charge and what incentive does...Ch. 12 - What is a marketable permit and what incentive...Ch. 12 - What are better-defined property rights and what...Ch. 12 - As the extent of environmental protection expands,...Ch. 12 - As the extent of environmental protection expands,...Ch. 12 - What are the economic tradeoffs between low-income...Ch. 12 - What arguments d0 low-income countries make in...Ch. 12 - In the tradeoff between economic output and...Ch. 12 - What does a point inside the production...Ch. 12 - Suppose you want to put a dollar value on the...Ch. 12 - Would environmentalists favor command-and-control...Ch. 12 - Consider two ways of protecting elephants from...Ch. 12 - Will a system of marketable permits work with...Ch. 12 - Is zero pollution possible under a marketable...Ch. 12 - Is zero pollution an optimal goal? Way or why not?Ch. 12 - From an economic perspective, is it sound policy...Ch. 12 - Recycling is a relatively inexpensive solution to...Ch. 12 - Can extreme levels of pollution hurt the economic...Ch. 12 - How can high-income countries benefit from...Ch. 12 - Technological innovations shift the production...Ch. 12 - Show the market for cigarettes in equilibrium,...Ch. 12 - Refer to Table 12.2. The externality created by...Ch. 12 - Table 12.12, shows the supply and demand...Ch. 12 - A city currently emits 15 million gallons (MG) of...Ch. 12 - In the Land of Purity, there is only one form of...
Additional Business Textbook Solutions
Find more solutions based on key concepts
Discussion Questions 1. What characteristics of the product or manufacturing process would lead a company to us...
Managerial Accounting (4th Edition)
Prepare a production cost report and journal entries (Learning Objectives 4 5) Vintage Accessories manufacture...
Managerial Accounting (5th Edition)
A piece of equipment is purchased for $40,000 and has an estimated salvage value of $1,000 at the end of the re...
Construction Accounting And Financial Management (4th Edition)
E6-14 Using accounting vocabulary
Learning Objective 1, 2
Match the accounting terms with the corresponding d...
Horngren's Accounting (12th Edition)
What are the five steps in the planning process?
Principles of Management
A company calculated the predetermined overhead based on an estimated overhead of $70.000, and the activity for...
Principles of Accounting Volume 2
Knowledge Booster


Learn more about
Need a deep-dive on the concept behind this application? Look no further. Learn more about this topic, economics and related others by exploring similar questions and additional content below.Similar questions
- Economists sometimes shock noneconomists by stating that they do not favor the complete elimination of pollution. Explain the rationale for this position.arrow_forwardDraw a standard supply and demand diagram for televisions, and indicate the equilibrium price and output. a. Assuming that the production of televisions generates external costs, illustrate the effect of the producers being forced to pay a tax equal to the external costs generated, and indicate the equilibrium output. b. If instead of generating external costs, television production generates external benefits, illustrate the effect of the producers being given a subsidy equal to the external benefits generated, and indicate the equilibrium output.arrow_forwardThe supply and demand conditions facing a firm that makes widgets and generates a negative externality by dumping a highly toxic sludge in a nearby river is given in the table below. Price Quantity Demanded Quantity Supplied without Paying Social Costs Quantity Supplied after Paying Social Costs 100 0 120 75 80 10 100 50 55 30 90 30 40 55 85 25 30 80 80 20 20 100 65 15 The equilibrium price and quantity when social costs are taken into account are Question 12 options: Price = $55, Quantity = 30 Price = $40, Quantity = 55 Price = $30, Quantity = 20 Price = $30, Quantity = 80arrow_forward
- The supply and demand conditions facing a firm that makes widgets and generates a negative externality by dumping a highly toxic sludge in a nearby river is given in the table below. Price Quantity Demanded Quantity Supplied without Paying Social Costs Quantity Supplied after Paying Social Costs 100 0 120 75 80 10 100 50 55 30 90 30 40 55 85 25 30 80 80 20 20 100 65 15 The equilibrium price and quantity when only private costs are taken into account are Question 11 options: Price = $55, Quantity = 30 Price = $40, Quantity = 55 Price = $30, Quantity = 20 Price = $30, Quantity = 80arrow_forwardPRICE OF CARS 1. Efficiency in the presence of externalities Cars impose many external costs on society: carbon dioxide emissions that contribute to air pollution, congestion on roadways, and so on. Therefore, the market equilibrium quantity of cars is not equal to the socially efficient quantity. The following graph shows the demand for cars (their marginal private benefit), the supply of cars (the marginal private cost of producing them), and the marginal social cost of cars, including both the marginal private cost and external costs. Use the black point (plus symbol) to indicate the market equilibrium quantity. Next, use the purple point (diamond symbol) to indicate the socially efficient quantity. Demand (MPB, MSB) QUANTITY OF CARS As a result, the market output is MSC + Market Output Socially Efficient Output Supply (MPC) the socially efficient output. (?) Which of the following policies could help the government achieve the socially efficient outcome? Check all that apply. ☐…arrow_forwardTable 1 shows the demand schedule for electricity from a coal burning utility. Table 2 shows the utility's cost of producing electricity and the external cost of the pollution created. With no pollution control, calculate the quantity of electricity produced, the price of electricity, and the marginal external cost of the pollution generated. With no pollution control, the quantity of electricity produced is The price of electricity is cents a kilowatt. kilowatts a day. Table 1 Table 2 Price (cents per kilowatt) 4 8 12 16 20 24 Quantity (kilowatts per day) 0 100 200 300 400 500 Marginal cost 0 2 4 6 8 10 Quantity demanded (kilowatts per day) 500 400 300 200 100 0 Marginal external cost (cents per kilowatt) 0 2 4 6 8 10arrow_forward
- The table below shows the demand for pollution permits to emit hydrocarbons in a particular industrial park. Each permit allows the owner to release one tonne of pollutants into the atmosphere. Price per Pollution Permit Quantity of Permits $4,500 100 4,000 200 3,500 300 3,000 400 2,500 500 2,000 600 1,500 700 were charged, how many tonnes of pollutants would be discharged into the atmosphere, assuming a straight-line a. If fee for a pollution perm demand curve? Quantity: tonnes b. Suppose government were to set a fee of $2,500 per pollution permit. How many tonnes of pollutants would now be dumped? What is the total revenue received by government? Quantity: tonnes Total revenue: $ c. Suppose that a new technology allows for a significant reduction in hydrocarbons at a relatively low cost so that the demand for pollution permits in the industrial park drops by 200 tonnes. Assuming that government holds the permit fee at $2,500, how many tonnes of pollutants would now be dumped? What…arrow_forwardA set of perfectly competitive companies produce shoes. 1 pound of water pollution (WP) is released into the ocean which has a social cost of $c (per pound). The private cost of pollution is $0 when unregulated. i) Graph supply and demand curves and show the output and price of the unregulated market as well as the socially optimal output. ii) Indicate on the graph the amount of tax that would lead to the socially optimal level of production. iii) One of the companies produces Q shoes. Say there are pollution-reducing machines, K, which cost $1 each. When K = Ő machines, WP = 1 pound. With higher K, WP is lower. Give the cost-minimizing choice of WP and K when pollution is unregulated? Please explain with a diagram. iv) What would be the optimal tax rate if the government were to tax water pollution? v) When output of shoes Q is held constant, how do K and WP change when a pollution tax is instated?arrow_forwardEfficiency in the presence of externalities Air horns impose many external costs on society: the risk of being deafened, the annoyance of being awakened in the middle of the night, and so on. Therefore, the market equilibrium quantity of air horns is not equal to the socially optimal quantity. The following graph shows the demand for air horns (their private value), the supply of air horns (the private cost of producing them), and the social cost of air horns, including both the private cost and external costs. Use the black point (plus symbol) to indicate the market equilibrium quantity. Next, use the purple point (diamond symbol) to indicate the socially optimal quantity.arrow_forward
- The graph shows the demand curve for nursing education. The marginal cost of this education is a constant $4,000 per student per year and the marginal external benefit is a constant $2,000 per student per year. If the government offers students vouchers, what is the value of the voucher that will achieve the efficient number of students? 14- 12- 10- Price and cost (thousands of dollars) Use the graph to show value of the voucher that will achieve the efficient number of students. Draw the marginal social benefit curve. Label it MSB. 8- 6- 4- Draw an arrow at the efficient number of students that shows the value of the voucher that achieves the efficient number of students. 2- The value of the voucher that achieves the efficient number of students is $ ,000 a student. MSC D= MB 20 40 60 80 Students (thousands per year) C Draw only the objects specified in the question.arrow_forwardMacmillan Learning The accompanying schedule depicts the marginal social cost (MSC) and the marginal social benefit (MSB) associated with pollution emissions. Assume the polluters bear none of the social cost of pollution and all of the benefits. Quantity is measured in tons. Social Cost- Benefit Schedule Q MSB MSC What is the socially optimal amount of pollution? 9 tons 7 tons 8 tons 0 tons What is the size of the tax that would move the market to this socially optimal quantity? What is the size of the tax that would move the market to this socially optimal quantity? $135 per ton $105 per ton $120 per ton $150 per ton 4 180 60 09 5 165 75 75 6 150 90 00 7 135 105 8 120 120 9 105 135 10 90 150 = 11 75 165 12 60 00 180 13 45 195 14 30 210 15 15 225 16 0 240arrow_forwardImagine the government of California has proposed a new tax on vehicles based on the amount of emissions they produce in a year. In 2019, there will be 20 tons of emissions produced. The governor’s office has run the calculations and found that the socially optimal level is 14 tons and the marginal damage from each unit of pollution is $150. Imagine there are two types of drivers in California: commuters and non-commuters. Imagine that the marginal cost of reducing pollution for commuters is MCA_C=150Q and the marginal cost of reducing pollution for non-commuters is MCA_N=30Q. Each type initially created ten tons of pollution each. Their total cost of reductions is equal to TCA_C=75Q^2 and TCA_N=15Q^2. How much would each type choose to reduce under the tax? Imagine the governor instead suggested forcing all drivers to reduce their emissions by 30% from their 2019 levels. How would the costs of reduction here compare to the taxation case (please provide actual numbers)? Do you…arrow_forward
arrow_back_ios
SEE MORE QUESTIONS
arrow_forward_ios
Recommended textbooks for you


 Exploring EconomicsEconomicsISBN:9781544336329Author:Robert L. SextonPublisher:SAGE Publications, Inc
 Economics (MindTap Course List)EconomicsISBN:9781337617383Author:Roger A. ArnoldPublisher:Cengage Learning
Exploring Economics
Economics
ISBN:9781544336329
Author:Robert L. Sexton
Publisher:SAGE Publications, Inc
Economics (MindTap Course List)
Economics
ISBN:9781337617383
Author:Roger A. Arnold
Publisher:Cengage Learning
Environmental Law: The Clean Air Act; Author: LawShelf;https://www.youtube.com/watch?v=1-SH3kJpVA4;License: Standard Youtube License