
Concept explainers
Videos
(a)
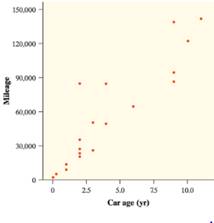
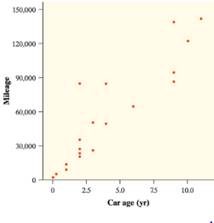
To Explain: the 95% confidence interval for the slope of the population regression line is (9016.4, 14244.8).
(a)
Answer to Problem 21E
(9016.443, 14244.757)
Explanation of Solution
Given:

Formula used:
The boundaries of the confidence interval are
Calculation:
The degrees of freedom
The critical t-value can be found in table B mention in the row of
The boundaries of the confidence interval are
(9016.443, 14244.757)
The slight deviation is there due to rounding errors.
(b)
To Explain: that an appropriate pair of hypotheses for this test is
(b)
Answer to Problem 21E
Explanation of Solution
Given:


Claim: the typical driver puts 15000 miles per year on its own main vehicle.
This implies that mileage is predicted to be about 15000 miles per year, which associates with a slope of 15000. The null hypothesis statement is that the population parameter is equal to the value mention in the claim:
The alternative hypothesis statement is the opposite of the null hypothesis:
(c)
To find: the standardized test statistic and P-value on the basis of part (b) and conclusion at the
(c)
Answer to Problem 21E
There is enough convincing evident to help the claim that the car age does not increase by 15,000 mileages per year.
Explanation of Solution
Given:

Formula used:
The test statistics
Calculation:
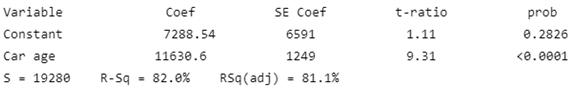
The calculation of
The standard error of the calculation of
The test static:
The P-value is the probability of getting the value of the test static, when that the null hypothesis is true.
If the P-value is equal or less than to the significance level, then the null hypothesis is rejected:
There is enough convincing evident to help the claim that the car age does not increase by 15,000 mileages per year.
(d)
To find: that the conclusion of part (a) and part (c) is same or not.
(d)
Answer to Problem 21E
There is enough proof to reject the claim that AP Statistic teachers are typical drivers.
Explanation of Solution
Given:

Confidence interval found in part a:
(9016.443, 14244.757)
The confidence interval is not having 15000 and therefore it is unlikely to get
Chapter 12 Solutions
PRACTICE OF STATISTICS F/AP EXAM
Additional Math Textbook Solutions
Elementary Statistics (13th Edition)
Statistics for Business and Economics (13th Edition)
Statistical Reasoning for Everyday Life (5th Edition)
Fundamentals of Statistics (5th Edition)
Introductory Statistics (2nd Edition)


 MATLAB: An Introduction with ApplicationsStatisticsISBN:9781119256830Author:Amos GilatPublisher:John Wiley & Sons Inc
 Probability and Statistics for Engineering and th...StatisticsISBN:9781305251809Author:Jay L. DevorePublisher:Cengage Learning
 Statistics for The Behavioral Sciences (MindTap C...StatisticsISBN:9781305504912Author:Frederick J Gravetter, Larry B. WallnauPublisher:Cengage Learning
 Elementary Statistics: Picturing the World (7th E...StatisticsISBN:9780134683416Author:Ron Larson, Betsy FarberPublisher:PEARSON
 The Basic Practice of StatisticsStatisticsISBN:9781319042578Author:David S. Moore, William I. Notz, Michael A. FlignerPublisher:W. H. Freeman
 Introduction to the Practice of StatisticsStatisticsISBN:9781319013387Author:David S. Moore, George P. McCabe, Bruce A. CraigPublisher:W. H. Freeman