PRACTICE OF STATISTICS F/AP EXAM
6th Edition
ISBN: 9781319113339
Author: Starnes
Publisher: MAC HIGHER
bartleby

Concept explainers

bartleby

Videos

Question
Book Icon
Chapter 12.1, Problem 7E

(a)

To determine

To find: the estimate for β0 , explain this value.

(a)

Expert Solution
Check Mark

Answer to Problem 7E

  b0 =-0.012701

The content of blood alcohol is on average -0.012701, when the student drinks 0 beers.

Explanation of Solution

Given:

  PRACTICE OF STATISTICS F/AP EXAM, Chapter 12.1, Problem 7E , additional homework tip  1

  β0 Corresponds to the y intercepting to the population regression line, it can be estimated by the y intercept b0 of the regression line of sample.

  b0 =-0.012701

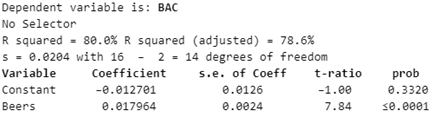
The y-intercept shows the average value of y when x=0

The content of blood alcohol is on average -0.012701, when the student drinks 0 beers.

(b)

To determine

To find: the estimate for β1 , explain this value.

(b)

Expert Solution
Check Mark

Answer to Problem 7E

The beer alcohol content increases by 0.017964 per beer on average.

Explanation of Solution

Given:

  PRACTICE OF STATISTICS F/AP EXAM, Chapter 12.1, Problem 7E , additional homework tip  2

  β1 Corresponds to the slope of the population regression line, it can be estimated by the slope of the b1 of the regression line of sample.

  b1 = 0.017964

Slope is representing the average increase of y per unit of x.

The beer alcohol content increases by 0.017964 per beer on average.

(c)

To determine

To find: the estimate for σ , explain this value.

(c)

Expert Solution
Check Mark

Answer to Problem 7E

The expected BAC of an individual that is at least 21 years of age deviates on average by 0.0204 about the actual BAC.

Explanation of Solution

Given:

  PRACTICE OF STATISTICS F/AP EXAM, Chapter 12.1, Problem 7E , additional homework tip  3

  σ Shows the population standard deviation of the residual, it is estimated by the sample standard deviation of the residuals s.

s=0.0204

Standard error of the estimate s shows the average error of prediction, therefore the average deviation between actual values of y and the predicted y values.

The expected BAC of an individual that is at least 21 years of age deviates on average by 0.0204 about the actual BAC.

(d)

To determine

To find: the standard error of the slope SEb1 , explain this value.

(d)

Expert Solution
Check Mark

Answer to Problem 7E

Slope of regression line vary on average about 0.0024 from the slope of the population regression line.

Explanation of Solution

Given:

  PRACTICE OF STATISTICS F/AP EXAM, Chapter 12.1, Problem 7E , additional homework tip  4

Standard error of the slope SEb1 is mention in the row of “Beers” and in the column s. E. Of coeff of the mention computer output

  SEb1 =0.0024

Standard error of the slope shows the average deviation of the slope of regression line of the sample from the population regression line of the slope.

Slope of regression line vary on average about 0.0024 from the slope of the population regression line.

Chapter 12 Solutions

PRACTICE OF STATISTICS F/AP EXAM

Ch. 12.1 - Prob. 11ECh. 12.1 - Prob. 12ECh. 12.1 - Prob. 13ECh. 12.1 - Prob. 14ECh. 12.1 - Prob. 15ECh. 12.1 - Prob. 16ECh. 12.1 - Prob. 17ECh. 12.1 - Prob. 18ECh. 12.1 - Prob. 19ECh. 12.1 - Prob. 20ECh. 12.1 - Prob. 21ECh. 12.1 - Prob. 22ECh. 12.1 - Prob. 23ECh. 12.1 - Prob. 24ECh. 12.1 - Prob. 25ECh. 12.1 - Prob. 26ECh. 12.1 - Prob. 27ECh. 12.1 - Prob. 28ECh. 12.1 - Prob. 29ECh. 12.1 - Prob. 30ECh. 12.1 - Prob. 31ECh. 12.1 - Prob. 32ECh. 12.2 - Prob. 33ECh. 12.2 - Prob. 34ECh. 12.2 - Prob. 35ECh. 12.2 - Prob. 36ECh. 12.2 - Prob. 37ECh. 12.2 - Prob. 38ECh. 12.2 - Prob. 39ECh. 12.2 - Prob. 40ECh. 12.2 - Prob. 41ECh. 12.2 - Prob. 42ECh. 12.2 - Prob. 43ECh. 12.2 - Prob. 44ECh. 12.2 - Prob. 45ECh. 12.2 - Prob. 46ECh. 12.2 - Prob. 47ECh. 12.2 - Prob. 48ECh. 12.2 - Prob. 49ECh. 12.2 - Prob. 50ECh. 12.2 - Prob. 51ECh. 12.2 - Prob. 52ECh. 12.2 - Prob. 53ECh. 12.2 - Prob. 54ECh. 12.2 - Prob. 55ECh. 12.2 - Prob. 56ECh. 12.2 - Prob. 57ECh. 12.2 - Prob. 58ECh. 12 - Prob. R12.1RECh. 12 - Prob. R12.2RECh. 12 - Prob. R12.3RECh. 12 - Prob. R12.4RECh. 12 - Prob. R12.5RECh. 12 - Prob. R12.6RECh. 12 - Prob. T12.1SPTCh. 12 - Prob. T12.2SPTCh. 12 - Prob. T12.3SPTCh. 12 - Prob. T12.4SPTCh. 12 - Prob. T12.5SPTCh. 12 - Prob. T12.6SPTCh. 12 - Prob. T12.7SPTCh. 12 - Prob. T12.8SPTCh. 12 - Prob. T12.9SPTCh. 12 - Prob. T12.10SPTCh. 12 - Prob. T12.11SPTCh. 12 - Prob. T12.12SPTCh. 12 - Prob. AP4.1CPTCh. 12 - Prob. AP4.2CPTCh. 12 - Prob. AP4.3CPTCh. 12 - Prob. AP4.4CPTCh. 12 - Prob. AP4.5CPTCh. 12 - Prob. AP4.6CPTCh. 12 - Prob. AP4.7CPTCh. 12 - Prob. AP4.8CPTCh. 12 - Prob. AP4.9CPTCh. 12 - Prob. AP4.10CPTCh. 12 - Prob. AP4.11CPTCh. 12 - Prob. AP4.12CPTCh. 12 - Prob. AP4.13CPTCh. 12 - Prob. AP4.14CPTCh. 12 - Prob. AP4.15CPTCh. 12 - Prob. AP4.16CPTCh. 12 - Prob. AP4.17CPTCh. 12 - Prob. AP4.18CPTCh. 12 - Prob. AP4.19CPTCh. 12 - Prob. AP4.20CPTCh. 12 - Prob. AP4.21CPTCh. 12 - Prob. AP4.22CPTCh. 12 - Prob. AP4.23CPTCh. 12 - Prob. AP4.24CPTCh. 12 - Prob. AP4.25CPTCh. 12 - Prob. AP4.26CPTCh. 12 - Prob. AP4.27CPTCh. 12 - Prob. AP4.28CPTCh. 12 - Prob. AP4.29CPTCh. 12 - Prob. AP4.30CPTCh. 12 - Prob. AP4.31CPTCh. 12 - Prob. AP4.32CPTCh. 12 - Prob. AP4.33CPTCh. 12 - Prob. AP4.34CPTCh. 12 - Prob. AP4.35CPTCh. 12 - Prob. AP4.36CPTCh. 12 - Prob. AP4.37CPTCh. 12 - Prob. AP4.38CPTCh. 12 - Prob. AP4.39CPTCh. 12 - Prob. AP4.40CPTCh. 12 - Prob. AP4.41CPTCh. 12 - Prob. AP4.42CPTCh. 12 - Prob. AP4.43CPTCh. 12 - Prob. AP4.44CPTCh. 12 - Prob. AP4.45CPTCh. 12 - Prob. AP4.46CPT
Knowledge Booster
Background pattern image
Statistics
Learn more about
Need a deep-dive on the concept behind this application? Look no further. Learn more about this topic, statistics and related others by exploring similar questions and additional content below.
Recommended textbooks for you
Text book image
MATLAB: An Introduction with Applications
Statistics
ISBN:9781119256830
Author:Amos Gilat
Publisher:John Wiley & Sons Inc
Text book image
Probability and Statistics for Engineering and th...
Statistics
ISBN:9781305251809
Author:Jay L. Devore
Publisher:Cengage Learning
Text book image
Statistics for The Behavioral Sciences (MindTap C...
Statistics
ISBN:9781305504912
Author:Frederick J Gravetter, Larry B. Wallnau
Publisher:Cengage Learning
Text book image
Elementary Statistics: Picturing the World (7th E...
Statistics
ISBN:9780134683416
Author:Ron Larson, Betsy Farber
Publisher:PEARSON
Text book image
The Basic Practice of Statistics
Statistics
ISBN:9781319042578
Author:David S. Moore, William I. Notz, Michael A. Fligner
Publisher:W. H. Freeman
Text book image
Introduction to the Practice of Statistics
Statistics
ISBN:9781319013387
Author:David S. Moore, George P. McCabe, Bruce A. Craig
Publisher:W. H. Freeman
Correlation Vs Regression: Difference Between them with definition & Comparison Chart; Author: Key Differences;https://www.youtube.com/watch?v=Ou2QGSJVd0U;License: Standard YouTube License, CC-BY
Correlation and Regression: Concepts with Illustrative examples; Author: LEARN & APPLY : Lean and Six Sigma;https://www.youtube.com/watch?v=xTpHD5WLuoA;License: Standard YouTube License, CC-BY