
Concept explainers
Videos
(a)
To construct: an appropriate scatter plot predicting click through rate from position.
(a)
Answer to Problem 50E
There is negative, strong, curved relation between position and click through rate.
Explanation of Solution
Given:
| Position | Click through rate |
| 1 | 23.53 |
| 2 | 14.94 |
| 3 | 11.19 |
| 4 | 7.47 |
| 5 | 5.29 |
| 6 | 3.8 |
| 7 | 2.79 |
| 8 | 2.11 |
| 9 | 1.57 |
| 10 | 1.18 |
Graph:
Scatter plot

Form: curved, the reason is that the points are not lying on the straight line
Direction: Negative, the reason is that the pattern is downwards in the scatter plot.
Strength: strong, the reason is that all points lie don’t deviate much from the general pattern in the points.
(b)
To Explain: that this relationship follows an exponential model or a power model.
(b)
Answer to Problem 50E
Exponential Model
Explanation of Solution
Given:
| Position | Click through rate |
| 1 | 23.53 |
| 2 | 14.94 |
| 3 | 11.19 |
| 4 | 7.47 |
| 5 | 5.29 |
| 6 | 3.8 |
| 7 | 2.79 |
| 8 | 2.11 |
| 9 | 1.57 |
| 10 | 1.18 |
Graph:
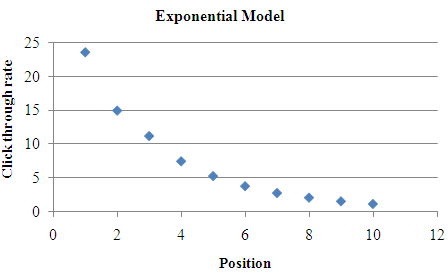
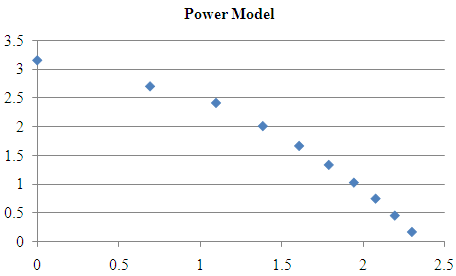
The scatter plot of position v/s log (click through rate) represent no strong curved, that means that an exponential model would be appropriate.
(c)
To Explain: the equation of the regression line.
(c)
Answer to Problem 50E
Explanation of Solution
Given:
| Position | Click through rate |
| 1 | 23.53 |
| 2 | 14.94 |
| 3 | 11.19 |
| 4 | 7.47 |
| 5 | 5.29 |
| 6 | 3.8 |
| 7 | 2.79 |
| 8 | 2.11 |
| 9 | 1.57 |
| 10 | 1.18 |
Formula used:
Calculation:
X is the logarithm of length and Y is the logarithm of heart weight
| Position | Click through rate | X | Y | XY | X2 |
| 1 | 23.53 | 0 | 3.158276203 | 0 | 0 |
| 2 | 14.94 | 0.693147181 | 2.70404218 | 1.874299213 | 0.480453 |
| 3 | 11.19 | 1.098612289 | 2.415020522 | 2.653171223 | 1.206949 |
| 4 | 7.47 | 1.386294361 | 2.010894999 | 2.787692398 | 1.921812 |
| 5 | 5.29 | 1.609437912 | 1.665818246 | 2.68103104 | 2.59029 |
| 6 | 3.8 | 1.791759469 | 1.335001067 | 2.392000803 | 3.210402 |
| 7 | 2.79 | 1.945910149 | 1.026041596 | 1.996584755 | 3.786566 |
| 8 | 2.11 | 2.079441542 | 0.746687947 | 1.552693937 | 4.324077 |
| 9 | 1.57 | 2.197224577 | 0.451075619 | 0.991114437 | 4.827796 |
| 10 | 1.18 | 2.302585093 | 0.165514438 | 0.381111079 | 5.301898 |
| XY | X2 | ||||
| 0 | 0 |
Using from the table find the value of a and b
Substituting the value of a and b in the regression equation formula
The least squares regression equation
Where x is the position and y the click through rate
(d)
To Explain: the prediction from the part (c) of the click through rate for a website in the 11th position.
(d)
Answer to Problem 50E
0.784152%
Explanation of Solution
Given:
| Position | Click through rate |
| 1 | 23.53 |
| 2 | 14.94 |
| 3 | 11.19 |
| 4 | 7.47 |
| 5 | 5.29 |
| 6 | 3.8 |
| 7 | 2.79 |
| 8 | 2.11 |
| 9 | 1.57 |
| 10 | 1.18 |
Calculation:
Using the part (c)
Putting the value of x
Taking the exponential
Therefore the expected click through rate is 0.784152%
Chapter 12 Solutions
PRACTICE OF STATISTICS F/AP EXAM
Additional Math Textbook Solutions
Introductory Statistics (10th Edition)
Elementary Statistics: Picturing the World (6th Edition)
Basic Business Statistics, Student Value Edition
Elementary Statistics (13th Edition)
Essentials of Statistics, Books a la Carte Edition (5th Edition)
Statistical Reasoning for Everyday Life (5th Edition)


 MATLAB: An Introduction with ApplicationsStatisticsISBN:9781119256830Author:Amos GilatPublisher:John Wiley & Sons Inc
 Probability and Statistics for Engineering and th...StatisticsISBN:9781305251809Author:Jay L. DevorePublisher:Cengage Learning
 Statistics for The Behavioral Sciences (MindTap C...StatisticsISBN:9781305504912Author:Frederick J Gravetter, Larry B. WallnauPublisher:Cengage Learning
 Elementary Statistics: Picturing the World (7th E...StatisticsISBN:9780134683416Author:Ron Larson, Betsy FarberPublisher:PEARSON
 The Basic Practice of StatisticsStatisticsISBN:9781319042578Author:David S. Moore, William I. Notz, Michael A. FlignerPublisher:W. H. Freeman
 Introduction to the Practice of StatisticsStatisticsISBN:9781319013387Author:David S. Moore, George P. McCabe, Bruce A. CraigPublisher:W. H. Freeman