
Concept explainers
Videos
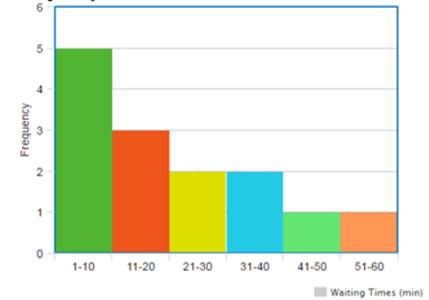
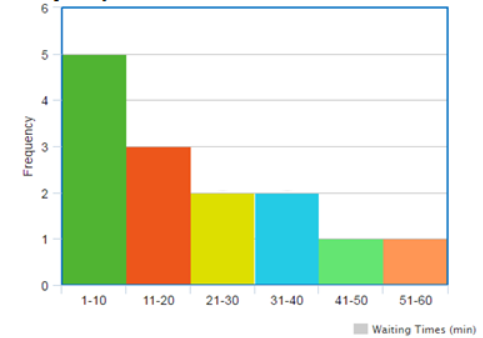
To make: a histogram for the given data.
Answer to Problem 12PPE
Explanation of Solution
Given:
The given data shows restaurant waiting times.
Calculation:
As the given data is
The minimum data value is 8, and the maximum value is 60.
Consider the data is divide into 5 intervals.
Therefore, create a frequency table:
| Restaurant waiting times | Frequency |
| | 5 |
| | 3 |
| | 2 |
| | 2 |
| | 1 |
| | 1 |
Draw and level the axes. Draw a bar to represent the frequency of each interval.
The histogram for the given data is:
Chapter 12 Solutions
High School Math 2015 Common Core Algebra 1 Student Edition Grade 8/9
Additional Math Textbook Solutions
Elementary Algebra
College Algebra (7th Edition)
College Algebra (6th Edition)
College Algebra
Linear Algebra with Applications (9th Edition) (Featured Titles for Linear Algebra (Introductory))
Intermediate Algebra (7th Edition)


 Algebra and Trigonometry (6th Edition)AlgebraISBN:9780134463216Author:Robert F. BlitzerPublisher:PEARSON
 Contemporary Abstract AlgebraAlgebraISBN:9781305657960Author:Joseph GallianPublisher:Cengage Learning
 Linear Algebra: A Modern IntroductionAlgebraISBN:9781285463247Author:David PoolePublisher:Cengage Learning
 Algebra And Trigonometry (11th Edition)AlgebraISBN:9780135163078Author:Michael SullivanPublisher:PEARSON
 Introduction to Linear Algebra, Fifth EditionAlgebraISBN:9780980232776Author:Gilbert StrangPublisher:Wellesley-Cambridge Press
 College Algebra (Collegiate Math)AlgebraISBN:9780077836344Author:Julie Miller, Donna GerkenPublisher:McGraw-Hill Education