
Concept explainers
Videos
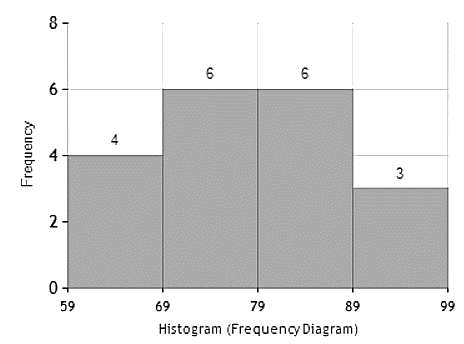
To find: the histogram frequency for the given data that uses the interval of 10.
Answer to Problem 24PPE

Explanation of Solution
Given:
The given data shows test score.
Calculation:
As the given data is
The minimum data value is 59, and the maximum value is 94.
Consider the data is divide into 5 intervals.
Therefore, create a frequency table:
| Costs of items | Frequency |
| | 4 |
| | 6 |
| | 6 |
| | 2 |
The histogram frequency for the given data is:
Chapter 12 Solutions
High School Math 2015 Common Core Algebra 1 Student Edition Grade 8/9
Additional Math Textbook Solutions
Intermediate Algebra for College Students (7th Edition)
College Algebra
Linear Algebra and Its Applications (5th Edition)
Algebra and Trigonometry (6th Edition)
College Algebra (5th Edition)
Differential Equations and Linear Algebra (4th Edition)


 Algebra and Trigonometry (6th Edition)AlgebraISBN:9780134463216Author:Robert F. BlitzerPublisher:PEARSON
 Contemporary Abstract AlgebraAlgebraISBN:9781305657960Author:Joseph GallianPublisher:Cengage Learning
 Linear Algebra: A Modern IntroductionAlgebraISBN:9781285463247Author:David PoolePublisher:Cengage Learning
 Algebra And Trigonometry (11th Edition)AlgebraISBN:9780135163078Author:Michael SullivanPublisher:PEARSON
 Introduction to Linear Algebra, Fifth EditionAlgebraISBN:9780980232776Author:Gilbert StrangPublisher:Wellesley-Cambridge Press
 College Algebra (Collegiate Math)AlgebraISBN:9780077836344Author:Julie Miller, Donna GerkenPublisher:McGraw-Hill Education