
Concept explainers
Videos
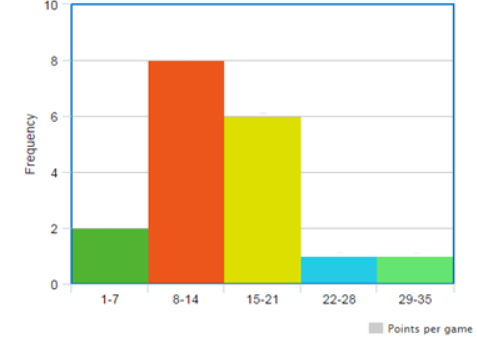
To make: a histogram for the given data.
Answer to Problem 13PPE

Explanation of Solution
Given:
The given data shows points per game.
Calculation:
As the given data is
The minimum data value is 2, and the maximum value is 33.
Consider the data is divide into 5 intervals.
Therefore, create a frequency table:
| Points per game | Frequency |
| | 2 |
| | 8 |
| | 6 |
| | 1 |
| | 1 |
Draw and level the axes. Draw a bar to represent the frequency of each interval.
The histogram for the given data is:
Chapter 12 Solutions
High School Math 2015 Common Core Algebra 1 Student Edition Grade 8/9
Additional Math Textbook Solutions
College Algebra
College Algebra with Modeling & Visualization (5th Edition)
Linear Algebra and Its Applications (5th Edition)
Differential Equations and Linear Algebra (4th Edition)
Elementary Algebra
Elementary Algebra: Concepts and Applications (10th Edition)


 Algebra and Trigonometry (6th Edition)AlgebraISBN:9780134463216Author:Robert F. BlitzerPublisher:PEARSON
 Contemporary Abstract AlgebraAlgebraISBN:9781305657960Author:Joseph GallianPublisher:Cengage Learning
 Linear Algebra: A Modern IntroductionAlgebraISBN:9781285463247Author:David PoolePublisher:Cengage Learning
 Algebra And Trigonometry (11th Edition)AlgebraISBN:9780135163078Author:Michael SullivanPublisher:PEARSON
 Introduction to Linear Algebra, Fifth EditionAlgebraISBN:9780980232776Author:Gilbert StrangPublisher:Wellesley-Cambridge Press
 College Algebra (Collegiate Math)AlgebraISBN:9780077836344Author:Julie Miller, Donna GerkenPublisher:McGraw-Hill Education