
Concept explainers
Videos
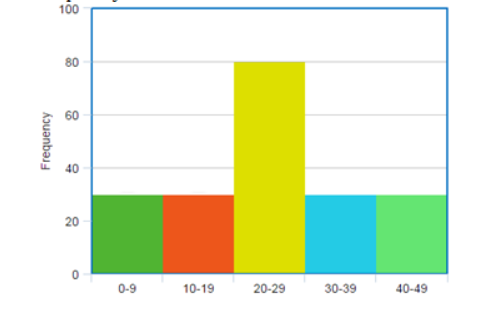
To make: a histogram for a set of 200 data values.
Answer to Problem 32PPE
Explanation of Solution
Given:
The interval of the 200 data is
Calculation:
According to the question, create the frequency table from the interval of the 200 data.
Now, in the interval
And rest of the data is equally divided in the remaining interval.
Thus, the remaining each interval
Now, the frequency table of the required interval is:
| Interval | Frequency |
| | 30 |
| | 30 |
| | 20 |
| | 30 |
| | 30 |
Draw and level the axes. Draw a bar to represent the frequency of each interval.
The histogram for the given data is:

Chapter 12 Solutions
High School Math 2015 Common Core Algebra 1 Student Edition Grade 8/9
Additional Math Textbook Solutions
Linear Algebra with Applications (2-Download)
Intermediate Algebra for College Students (7th Edition)
College Algebra
Differential Equations and Linear Algebra (4th Edition)
Introductory and Intermediate Algebra for College Students (5th Edition)
Algebra and Trigonometry (6th Edition)


 Algebra and Trigonometry (6th Edition)AlgebraISBN:9780134463216Author:Robert F. BlitzerPublisher:PEARSON
 Contemporary Abstract AlgebraAlgebraISBN:9781305657960Author:Joseph GallianPublisher:Cengage Learning
 Linear Algebra: A Modern IntroductionAlgebraISBN:9781285463247Author:David PoolePublisher:Cengage Learning
 Algebra And Trigonometry (11th Edition)AlgebraISBN:9780135163078Author:Michael SullivanPublisher:PEARSON
 Introduction to Linear Algebra, Fifth EditionAlgebraISBN:9780980232776Author:Gilbert StrangPublisher:Wellesley-Cambridge Press
 College Algebra (Collegiate Math)AlgebraISBN:9780077836344Author:Julie Miller, Donna GerkenPublisher:McGraw-Hill Education