
Concept explainers
Videos
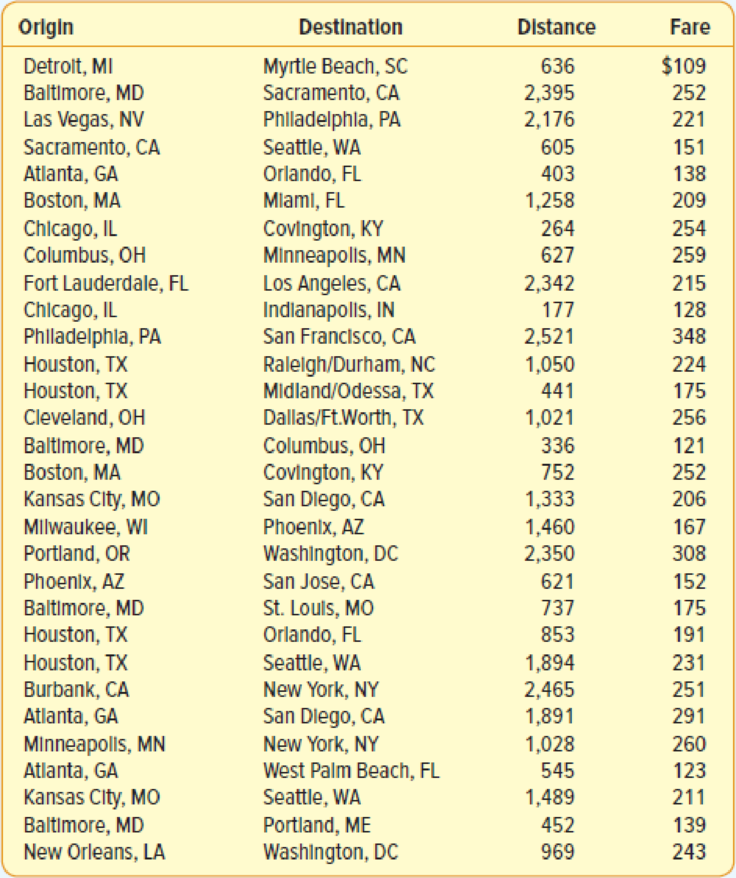
TravelAir.com samples domestic airline flights to explore the relationship between airfare and distance. The service would like to know if there is a
- a. Draw a
scatter diagram with Distance as the independent variable and Fare as the dependent variable. Is the relationship direct or indirect? - b. Compute the
correlation coefficient . At the .05 significance level, is it reasonable to conclude that the correlation coefficient is greater than zero? - c. What percentage of the variation in Fare is accounted for by Distance of a flight?
- d. Determine the regression equation. How much does each additional mile add to the fare? Estimate the fare for a 1,500-mile flight.
- e. A traveler is planning to fly from Atlanta to London Heathrow. The distance is 4,218 miles. She wants to use the regression equation to estimate the fare. Explain why it would not be a good idea to estimate the fare for this international flight with the regression equation.
a.
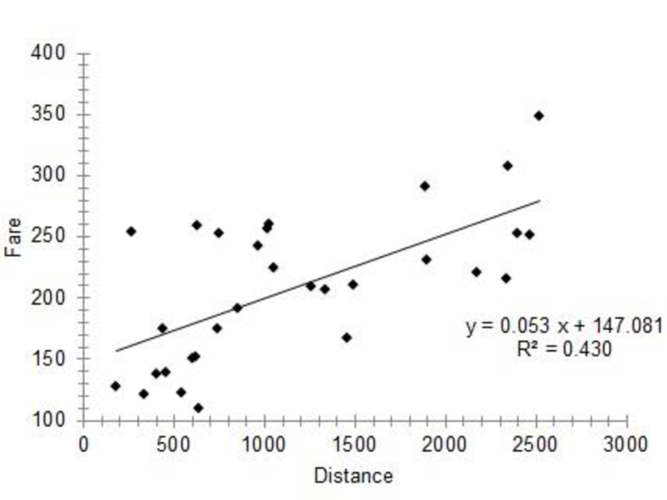
Construct a scatter diagram with Distance as the independent variable and Fare as the dependent variable.
Explain the relationship between the variables.
Answer to Problem 61CE
The scatter diagram of the data is as follows:
Explanation of Solution
Step-by-step procedure to obtain the scatterplot using MegaStat software:
- In an EXCEL sheet enter the data values of x and y.
- Go to Add-Ins > MegaStat > Correlation/Regression > Scatterplot.
- Enter horizontal axis as Sheet6!$X$1:$X$31 and vertical axis as Sheet6!$Y$1:$Y$31.
- Click on OK.
From the scatterplot of the data indicates an increasing trend. It shows that as the distance increases, the fare also increases. Therefore, there is a positive association between distance and fare.
Thus, the relationship is direct.
b.
Find the correlation coefficient.
Check whether the correlation coefficient is greater than zero.
Answer to Problem 61CE
The correlation coefficient is 0.656.
There is enough evidence to infer that the population correlation is positive.
Explanation of Solution
Step-by-step procedure to obtain the correlation coefficient using MegaStat software:
- In an EXCEL sheet enter the data values of x and y.
- Go to Add-Ins > MegaStat > Correlation/Regression > Correlation matrix.
- Enter Input Range as Sheet6!$X$1:$Y$31.
- Click on OK.
Output obtained using MegaStat is given as follows:
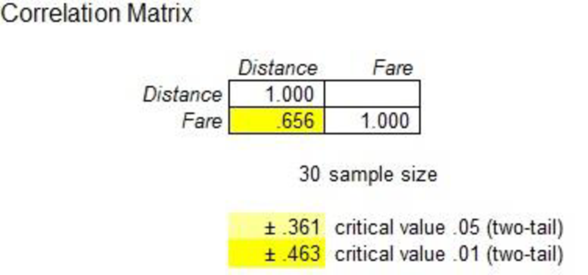
The correlation coefficient is 0.656.
Denote the population correlation as
The hypotheses are given below:
Null hypothesis:
That is, the correlation in the population is less than or equal to zero.
Alternative hypothesis:
That is, the correlation in the population is positive.
Test statistic:
The test statistic is as follows:
Here, the sample size is 30 and the correlation coefficient is 0.656.
The test statistic is as follows:
Degrees of freedom:
The level of significance is 0.05. Therefore,
Critical value:
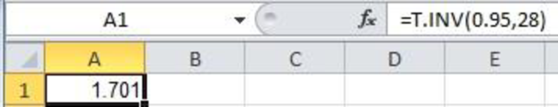
Step-by-step software procedure to obtain the critical value using EXCEL software:
- Open an EXCEL file.
- In cell A1, enter the formula “=T.INV (0.95, 28)”.
Output obtained using the EXCEL is given as follows:
Decision rule:
Reject the null hypothesis H0, if
Otherwise, fail to reject H0.
Conclusion:
The value of test statistic is 4.599 and the critical value is 1.701.
Here,
By the rejection rule, reject the null hypothesis.
Thus, there is enough evidence to infer that the population correlation is positive.
c.
Explain what percentage of the variation in ‘Fare’ is accounted for by ‘Distance’ of a flight.
Explanation of Solution
The coefficient of determination is the square of correlation coefficient.
From part (b), the correlation coefficient is 0.656.
Thus, the coefficient of determination is 0.43
Thus, about 43% of the variation in fares is explained by the variation in distance.
d.
Find the regression equation.
Explain how much does each additional mile add to the fare.
Find the fare for a 1,500 mile flight.
Answer to Problem 61CE
The regression equation is
The fare for a 1,500 mile flight is $226.1.
Explanation of Solution
Step-by-step procedure to obtain the ‘Regression equation’ using the MegaStat software:
- In an EXCEL sheet enter the data values of x and y.
- Go to Add-Ins > MegaStat > Correlation/Regression > Regression Analysis.
- Select input range as ‘Sheet6!$Y$1:$Y$31’ under Y/Dependent variable.
- Select input range ‘Sheet6!$X$1:$X$31’ under X/Independent variables.
- Click on OK.
Output using the Mega Stat software is given below:
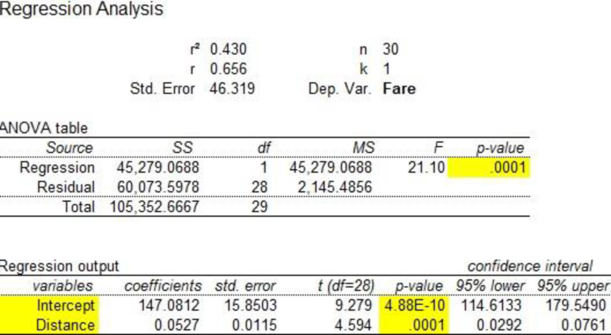
From the output, the regression equation is,
Thus, for each additional mile $0.0527 is added to the fare.
Substitute the value ‘1,500’ for ‘distance’ in the regression equation.
Thus, fare for a 1,500 mile flight is $226.1.
e.
Explain why it is not suitable to estimate the fare for the international flight with the regression equation.
Explanation of Solution
It is given that the distance is 4,218 miles. This flight is far away from the range of the sampled data. Thus, using the regression equation may not be suitable to estimate the fare for the flight.
Want to see more full solutions like this?
Chapter 13 Solutions
EBK STATISTICAL TECHNIQUES IN BUSINESS


 Glencoe Algebra 1, Student Edition, 9780079039897...AlgebraISBN:9780079039897Author:CarterPublisher:McGraw Hill
 Big Ideas Math A Bridge To Success Algebra 1: Stu...AlgebraISBN:9781680331141Author:HOUGHTON MIFFLIN HARCOURTPublisher:Houghton Mifflin Harcourt
 Holt Mcdougal Larson Pre-algebra: Student Edition...AlgebraISBN:9780547587776Author:HOLT MCDOUGALPublisher:HOLT MCDOUGAL