
Concept explainers
Videos
Reminder Round all answers to two decimal places unless otherwise indicated.
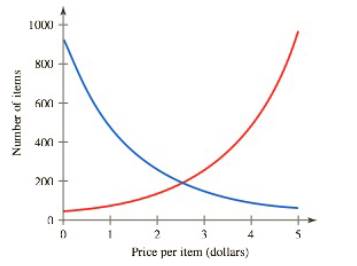
Equilibrium Price This is a continuation of Exorcise 5. The equilibrium price is the price where the supply and demand are the same. In Figure 1.31, the supply curve is in red and the demand curve is in blue. Use this graph to estimate the equilibrium price. How many items are supplied at the equilibrium price?
FIGURE
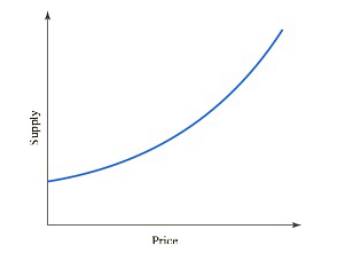
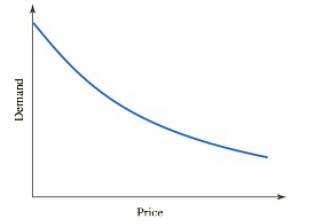
5. Supply and Demand Curves A supply curve is a graph that shows the quantity of a product that is made available by suppliers as a function of the price. Similarly, a demand curve is a graph that shows the quantity of a product that consumers are willing to purchase as a function of the price. Examples of supply and demand curves are shown in Figures
a. Explain in practical terms what the supply curve in Figure
b. Explain in practical terms what the demand curve in Figure 1.30 tells us.
FIGURE
FIGURE
Want to see the full answer?
Check out a sample textbook solution
Chapter 1 Solutions
Functions and Change: A Modeling Approach to College Algebra (MindTap Course List)


- Reminder: Round all answer to two decimal places unless otherwise indicated. 15.Total Cost The total cost C for a manufacturer during a given time period is a function of the number N of items produced during that period. To deter mine a formula for the total cost, we need to know the manufacturers fixed costs covering things such as plant maintenance and insurance, as well as the cost for each unit produced, which is called the variable cost. To find the total cost, we multiply the variable cost by the number of items produced during that period and then add the fixed costs. Suppose that a manufacturer of widgets has fixed costs of 9000 per month and that the variable cost is 15 per widget so it costs 15 to produce 1 widget. a. Use a formula to express the total cost C of this manufacturer in a month as a function of the number of widgets produced in a month. Be sure to state the units you use. b. Express using functional notation the total cost if there are 250 widgets produced in a month, and then calculate that value.arrow_forwardReminderRound all answers to two decimal places unless otherwise indicated. InflationDuring a period of high inflation, a political leader was up for re-election. Inflation had been increasing during his administration, but he announced that the rate of increase of inflation was decreasing. Draw a graph of inflation versus time that illustrates this situation. Would this announcement convince you that economic conditions were improving?arrow_forwardReminderRound all answers to two decimal places unless otherwise indicated. Protein Content of Wheat GrainProtein content of wheat grain is affected by soil moisture and the amount of available nitrogen among other things. Figure 1.45 shows" the percent of protein content of wheat grain versus pounds of nitrogen per acre applied in three separate situations. In each case, soil moisture refers to moisture at the soil depth of 2 inches to 12 inches. Situation 1: Irrigation was used when soil moisture dropped to 49. Situation 2: Irrigation was used when soil moisture dropped to 34. Situation 3: Irrigation was used when soil moisture dropped to 1. a. If irrigation begins when soil moisture reaches 49, what application of nitrogen will result in the lowest percentage of protein in wheat grain? b. If irrigation begins when soil moisture reaches 34, what application of nitrogen will result in the same protein content of wheat grain as beginning irrigation when soil moisture reaches 1? c. If you irrigate when soil moisture reaches 34, how much nitrogen should you apply to achieve a 13 protein content in wheat grain? d. Does Figure 1.45 indicate that, for nitrogen levels at 45 pounds per acre or higher, increased protein content in wheat grain is associated with higher or lower soil moisture? FIGURE 1.45 Protein content versus availability of nitrogenarrow_forward
- Reminder Round all answer to two decimal places unless otherwise indicated. Real Estate Sales A real estate agency has fixed monthly costs associated with rent, staff salaries, utilities, and supplies. It earns its money by taking a percentage commission on total real estate sales. During the month of July, the agency had total sales of 832,000 and showed a net income after paying fixed costs of 15,704. In August, total sales were 326,000 with a net income of only 532. a. Use a formula to express net income as a linear function of total sales. Be sure to identify what the letters that you use mean. b. Plot the graph of net income and identify the slope and vertical intercept. c. What are the real estate agencys fixed monthly costs? d. What percentage commission does the agency take on the sale of a home? e. Find the horizontal intercept and explain what this number means to the real estate agency.arrow_forwardReminderRound all answers to two decimal places unless otherwise indicated. Household DebtThe graph in Figure 1.27 shows the average American household debt h as a function of the date d. Here h(d) represents house hold debt as a percentage of disposable income. a.Explain the meaning of h(1975) in practical terms, and use the graph to find its value. b.The graph reaches a maximum value. Estimate the maximum value and the year in which it occurred. FIGURE 1.27arrow_forwardReminder Round all answers to two decimal places unless otherwise indicated. World Copper Production World production of copper, in millions of tons per year, from 1900 to 2000 is given by C=0.51.033t, where t is the time in years since 1900. a.What production level does this model give for the year 2000? b.If this model were extended to 2025, how could you use your knowledge of copper production in 2024 to estimate copper production in 2025?arrow_forward
- Reminder Round all answers to two decimal places unless otherwise indicated. Small Business Loan After t years, a small business owes B dollars on a loan. The balance draws a continuous compounding rate of 6 per year, and payments of 5000 per year are made to the lending institution. Then the equation of change for the account balance is given by dBdt=0.06B5000 a. Find the equilibrium solution. b. Explain what is happening at the equilibrium solution in practical terms. c. If the small business expects to pay off the loan eventually, should B be larger or smaller than the equilibrium solution?arrow_forwardReminder Round all answer to two decimal places unless otherwise indicated. Poverty in the United States Form 2000 through 2014, the percentage of Americans living below the poverty level is given approximately by 5 P=11.36+0.28t, Where t is the time, in years, since 2000. a. According to this model, what percentage of Americans lived below the poverty level in 2010? The actual number is 15.1.) b. What is the slope of this linear function? c. Explain in practical terms the meaning of the slope you found in part b.arrow_forwardReminder Round all answers to two decimal places unless otherwise indicated. Quarterly Pine Pulpwood PricesIn southwest Georgia, the average pine pulpwood prices vary predictably over the course of the year, primarily because of weather. Prices in 2009 followed this pattern. At the beginning of the first quarter, the average price P was 9 per ton. During the first quarter, prices declined steadily to 8 per ton, then remained steady at 8 per ton through the end of the third quarter. During the fourth quarter, prices increased steadily from 8 to 10 per ton. a.Sketch a graph of pulpwood prices as a function of the quarter in the year. b.What formula for price P as a function of t, the quarter, describes the price from the beginning of the year through the first quarter? c.What formula for price P as a function of t, the quarter, describes the price from the first to the third quarter? d.What formula for price P as a function of t, the quarter, describes the price from the third to the fourth quarter? e.Write a formula for price P throughout the year as a piecewise-defined function of t, the quarter.arrow_forward
- Reminder Round all answers to two decimal places unless otherwise indicated. Profit The total cost C for a manufacturer during a given time period is a function of the number N of items produced during that period. In this exercise, we measure all monetary values in dollars. To determine a formula for the total cost, we need to know the manufacturers fixed costs covering such things as plant maintenance and insurance as well as the cost for each unit produced, which is called the variable cost. To find the total cost, we multiply the variable cost by the number of items produced during that period and then add the fixed costs. The total revenue R for a manufacturer during a given time period is also a function of the number N of items produced during that period. To determine a formula for the total monthly revenue, we need to know the selling price p per unit of the item, which in general is also a function of N. To find the total revenue, we multiply this selling price by the number of items produced. The profit P for a manufacturer is the total revenue minus the total cost. Suppose that a manufacturer of widgets has a fixed costs of 2000 per month and that the variable cost is 30 per widget. Further, the manufacturer has developed the following table showing the highest price p, in dollars, of a widget at which N widgets can be sold. Number N Price p 200 41.00 250 40.50 300 40.00 350 39.50 a.Use a formula to express the total monthly cost C of this manufacturer as a function of N. b.Use the table to find a linear model of p as a function of N. c.Use your answer to part b to find a formula expressing the total monthly revenue R as function of N. d.Use your answers to part a and part c to find a formula expressing the monthly profit P as a function of N. What type of function is the profit: linear or quadratic? e.Find the two monthly production levels at which the manufacturer just breaks even that is, where the profit is zero.arrow_forwardReminder Round all answers to two decimal places unless otherwise indicated. Magazine SalesThe following table shows the income from sales of a certain magazine, measured in thousands of dollars, at the start of the given year. Year Income 2009 7.76 2010 8.82 2011 9.88 2012 10.94 2013 12.00 2014 13.08 2015 14.26 2016 15.54 Over an initial period the sales grew at a constant rate, and over the rest of the time the sales grew at a constant percentage rate. Calculate differences and ratios to determine what these time periods are, and find the growth rate or percentage growth rate, as appropriate.arrow_forwardReminderRound all answers to two decimal places unless otherwise indicated. Tornadoes In OklahomaThe graph in Figure 1.41 shows the number T=T(d) of tornadoes in Oklahoma Fl/EF1 and stronger reported by the National Climatic Data Center. Round your answers to the nearest whole number. a. When were the most tornadoes reported? How many were reported in that year? b. When were the fewest tornadoes reported? How many were reported in that year? c. What was the average yearly rate of decrease in tornadic activity from 2011 to 2012? d. What was the average yearly rate of increase in tornadic activity from 2009 to 2011? e. What was the average yearly rate of change that is, the average yearly rate of total increase or total decrease in tornadic activity from 2009 to 2012? FIGURE 1.41 Tornadoes in Oklahomaarrow_forward
 Functions and Change: A Modeling Approach to Coll...AlgebraISBN:9781337111348Author:Bruce Crauder, Benny Evans, Alan NoellPublisher:Cengage Learning