
Videos
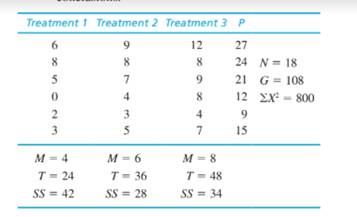
One of the primary advantages of a repealed-measures design, compared to an independent-measures design, is that it reduces the overall variability by removing variance caused by individual differences. The following data are from a research study comparing three treatment conditions.
- a. Assume that the data are from an independent- measures study using three separate samples, each with n = 6 participants. Ignore the column of P totals and use an independent-measures ANOVA with σ = .05 to test the significance of the mean differences.
- b. Now assume that the data are from a repealed- measures study using the same sample of n = 6 participants in all three treatment conditions. Use a repealed-measures ANOVA with α = .05 to test the significance of the mean differences.
- c. Explain why the two analyses lead to different conclusions.
a.
To test: The significance of the mean difference using independent measure ANOVA with
Answer to Problem 9P
The test of significance of the mean difference using independent measure ANOVA with
Explanation of Solution
Given info:
The data is provided in the question.
| Treatment 1 | Treatment 2 | Treatment 3 |
|
|
|
|
|
|
|
|
|
|
|
|
|
|
|
Calculation:
Step 1:
The null and alternative hypotheses are:
Null hypothesis:
Where
Alternate hypothesis:
Step 2:
Compute the degrees of freedom (df) for the between treatment effects, within treatment effects and total and corresponding sum of squares (SS).
Now, it is known that, for a given sample size, the degrees of freedom (df) is:
Thus,
The number of treatments,
As within treatments degrees of freedom,
With
Step 3:
Compute F-ratio.
The total sum of squares is:
The within treatment sum of squares is:
The within treatment sum of squares is:
Thus, here,
Now,
Similarly,
Finally F-ratio formula is:
Step 4:
Decision rule:
If
If
Since
Based on the result we fail to reject null and conclude, there is no significance difference among the three treatment.
b.
Answer to Problem 9P
Using repeated-measures ANOVA with
Explanation of Solution
Calculation:
Step 1:
The null and alternative hypotheses are:
Null hypothesis:
Where
Alternate hypothesis:
Step 2:
First stage:
Compute the degrees of freedom (df) for the between treatment effects, within treatment effects and total and corresponding sum of squares (SS).
Second stage:
Compute the values of between subject sum of squares and sum of squares due to error.
The between subject sum of squares is:
The sum of squares due to error is:
Thus,
Here,
Thus,
Step 3:
Step 4:
Decision rule:
If
If
Since
Based on result reject null and conclude significance mean difference exists.
c.
To find: Why the results of analysis differ in part a and part b.
Explanation of Solution
In part a, in independent-measures ANOVA, the individual differences is not present while in part b the individual differences exists. As a result, the individual differences have been eliminated in part b as these effects impact the results.
Thus, the results of analysis differ in part a and part b.
Want to see more full solutions like this?
Chapter 13 Solutions
Essentials of Statistics for the Behavioral Sciences


- The following data summarize the results from an independent-measures study comparing three treatment conditions. I II III n =10 n =10 n =10 s2 = 2.67 s2 = 2.00 s2 = 1.33 M =2 M =3 M =4 T = 20 T = 30 T = 40 Q.3.1. Use an ANOVA with α =.05 to determine whether there are any significant mean differences among the three means. (show your working). Hint: because the samples are all the same size, MSwihin is the average of the three sample variances.arrow_forwardPost-hoc tests are necessary for an analysis of variance comparing only two treatment conditions. t or farrow_forwardThe following data summarize the results from an independent-measures study comparing three treatment conditions. I II III n = 5 n = 5 n = 5 M = 2 M = 5 M = 8 N = 15 T = 10 T = 25 T = 40 G = 75 SS = 16 SS = 20 SS = 24 ΣX2 = 525 a. Calculate the sample variance for each of the three samples. b. Use an ANOVA with α = .05 to determine whether there are any significant differences among the three treatment means.arrow_forward
- In a one-way analysis of variance with three treatments, each with five measurements, in which a completely randomized design is used, what is the degrees of freedom for treatments?arrow_forwardTwo types of flares are tested and their burning times (in minutes) are recorded. Summary statistics are given below.Brand Xn=35x = 19.4 mins = 1.4 min Brand Yn=40x = 15.1 mins = 0.8 min Use a 0.08 significance level to test the claim that the two samples are from populations with the same mean. Use the traditional method or the P Value method of hypothesis testing.arrow_forwardA computer information systems manager is debating which of two similarly priced laptop battery packs to purchase. He is interested in determining whether there is a difference in the average time the battery packs function before needing to be recharged. Based on two independent random samples, the following summary information was computed: Model 1 Sample size 15 Sample mean 6.2 hours Sample standard deviation 2.6 hours Model 2 Sample size 16 S Sample mean 6.5 hours Sample standard deviation 2.6 hours Assuming normal populations with equal variances, calculate a 99% confidence interval for the difference in the average functioning time of the two models. 10 engineering schools were surveyed. The first random sample of 250 electrical engineers had 80 women, and the second random sample of 175 chemical engineers had 40 women. Obtain an 80% confidence interval for the difference in proportions of women in these two engineering fields.arrow_forward
- If the mean and variance are computed for each sample in an independent-measures two-factor experiment, then which types of sample data will tend to produce large F-ratios for the two-factor ANOVA? a. large differences between sample means and small sample variances b. large differences between sample means and large sample variances c. small differences between sample means and small sample variances d. small differences between sample means and large sample variancesarrow_forwardOne of the advantages of a repeated-measures design is that it removes the individual differences from the error variance and increases the likelihood of rejecting the null hypothesis. The following data were obtained from a research study comparing three treatment conditions. Treatment 1 Treatment 2 Treatment 3 6 8 10 G=48 5 5 5 1 2 3 0 1 2 T=12 SS=26 T=16 SS=30 T=20 SS=38 a. Assume that the data are from an independent-measures study (like in Chapter 12 normal ANOVA) using three separate samples, each with n=4 participants, and use an independent-measures ANOVA with a=.05 to test for significant differences among the three treatments. b.Assume that the data are from a repeated-measures study using one sample of n=4 participants and use a repeated-measures ANOVA with a=.05 to test for significant differences among the three treatments. c. Compare your results from part A and part B.arrow_forwardThe data below are from an independent-measures experiment comparing three different treatment conditions. Use an analysis of variance with α = .05 to determine whether these data indicate any significant differences among the treatments. Treatment1 Treatment2 Treatment3 0 1 4 0 4 3 0 1 6 2 0 3 M1=0.5 M2=1.5 M3=4 SS1=3 SS2=? SS3=6arrow_forward
- Consider the following data obtained for two samples selected at random from twopopulations that are independent and normally distributed with equal variances.Sample I Sample II32 2726 3531 3320 4027 3834 31Test at the 1% significance level whether the means of the populations from whichthese samples are drawn are equal.arrow_forwardAt the insistence of a government inspector, a new safety device is installed in an assembly-line operation. After the installation of this device, a random sample of 8 days’ output gave the following results for numbers of finished components produced:618 660 638 625 571 598 639 582Management is concerned about the variability of daily output and views any variance above 500 as undesirable. Test, at the 10% significance level, the null hypothesis that the population variance for daily output does not exceed 500.arrow_forwardOne of the advantages of a repeated-measures design is that it removes the individual differences from the error variance and increases the likelihood of rejecting the null hypothesis. The following data were obtained from a research study comparing three treatment conditions. Treatment 1 Treatment 2 Treatment 3 6 8 10 G=48 5 5 5 1 2 3 0 1 2 T=12 SS=26 T=16 SS=30 T=20 SS=38 Assume that the data are from an independent-measures study (like in Chapter 12 normal ANOVA) using three separate samples, each with n=4 participants, and use an independent-measures ANOVA with a=.05 to test for significant differences among the three treatments. Assume that the data are from a repeated-measures study using one sample of n=4 participants and use a repeated-measures ANOVA with a=.05 to test for significant differences among the three treatments.…arrow_forward
 Glencoe Algebra 1, Student Edition, 9780079039897...AlgebraISBN:9780079039897Author:CarterPublisher:McGraw Hill