
Cornerstones of Cost Management (Cornerstones Series)
4th Edition
ISBN: 9781305970663
Author: Don R. Hansen, Maryanne M. Mowen
Publisher: Cengage Learning
expand_more
expand_more
format_list_bulleted
Videos
Textbook Question
Chapter 14, Problem 12E
Kang Company reported sales of $3,240,000 in 20x5. At the end of the calendar year, the following quality costs were reported:
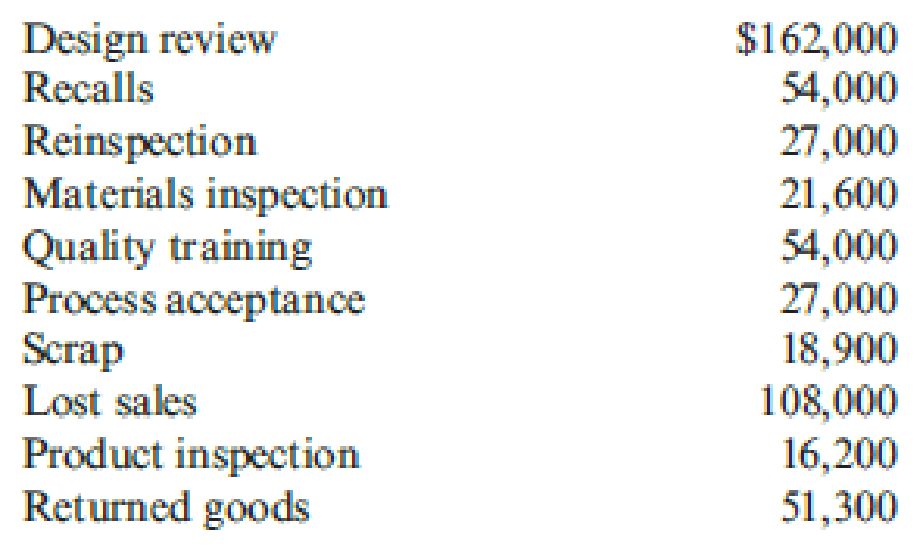
Required:
- 1. Prepare a quality cost report.
- 2. Prepare a graph (pie chart or bar graph) that shows the relative distribution of quality costs, and comment on the distribution.
Expert Solution & Answer

Trending nowThis is a popular solution!

Students have asked these similar questions
Belmain Co. expects to maintain the same inventories at the end of 20Y7 as at the beginning of the year. The total of all production costs for the year is therefore assumed to be equal to the cost of goods sold. With this in mind, the various department heads were asked to submit estimates of the costs for their departments during the year. A summary report of these estimates is as follows:
EstimatedFixed Cost
Estimated Variable Cost(per unit sold)
Production costs:
Direct materials
—
$22
Direct labor
—
14
Factory overhead
$272,400
11
Selling expenses:
Sales salaries and commissions
56,600
5
Advertising
19,200
—
Travel
4,300
—
Miscellaneous selling expense
4,700
4
Administrative expenses:
Office and officers' salaries
55,300
—
Supplies
6,800
2
Miscellaneous administrative expense
6,300
2
Total
$425,600
$60
It is…
The following information is available from the accounting records of EVA Corporation:Fixed cost per period is $4800. Sales volume for the last period was $19 360, and variable cost was $13 552. Capacity per period is a sales volume of $32 000.Draw a detailed break-even chart on a grid such as the one provided. Marks are awarded for determining the revenue and cost functions, correctness of plotted points and lines, correct labeling of axes, and overall neatness of the graph.
Belmain Co. expects to maintain the same inventories at the end of 20Y7 as at the beginning of the year. The total of all production costs for the year is therefore assumed to be equal to the cost of goods sold. With this in mind, the various department heads were asked to submit estimates of the costs for their departments during the year. A summary report of these estimates is as follows:
EstimatedFixed Cost
Estimated Variable Cost(per unit sold)
Production costs:
Direct materials
$26
Direct labor
17
Factory overhead
$114,300
13
Selling expenses:
Sales salaries and commissions
23,700
6
Advertising
8,000
Travel
1,800
Miscellaneous selling expense
2,000
5
Administrative expenses:
Office and officers' salaries
23,200
Supplies
2,900
2
Miscellaneous administrative expense
2,660
3
Total
$178,560
$72
It is…
Chapter 14 Solutions
Cornerstones of Cost Management (Cornerstones Series)
Ch. 14 - What is the difference between quality of design...Ch. 14 - Why are quality costs the costs of doing things...Ch. 14 - Prob. 3DQCh. 14 - Describe the Taguchi quality loss function, and...Ch. 14 - Identify and discuss the four kinds of quality...Ch. 14 - Explain why external failure costs can be more...Ch. 14 - Prob. 7DQCh. 14 - Prob. 8DQCh. 14 - Describe the three types of quality performance...Ch. 14 - Prob. 10DQ
Ch. 14 - If a firms annual sales are 200 million, what...Ch. 14 - Explain why it is important for a manager to...Ch. 14 - Prob. 13DQCh. 14 - Explain why the Accounting Department should be...Ch. 14 - Prob. 15DQCh. 14 - What is ecoefficiency?Ch. 14 - Prob. 17DQCh. 14 - Prob. 18DQCh. 14 - Prob. 19DQCh. 14 - What are the four categories of environmental...Ch. 14 - Prob. 21DQCh. 14 - What does full environmental costing mean? Full...Ch. 14 - What information is communicated by the unit...Ch. 14 - Evans Company had total sales of 3,000,000 for...Ch. 14 - Prob. 2CECh. 14 - Ross Company implemented a quality improvement...Ch. 14 - Nabors Company had actual quality costs for the...Ch. 14 - Verde Company reported operating costs of...Ch. 14 - Pinter Company had the following environmental...Ch. 14 - Rachel Boyce, president of a company that...Ch. 14 - Quality attributes such as performance and...Ch. 14 - Stahman, Inc., estimates its hidden external...Ch. 14 - Prob. 10ECh. 14 - Abernathy, Inc., produces two different generators...Ch. 14 - Kang Company reported sales of 3,240,000 in 20x5....Ch. 14 - Gagnon Company reported the following sales and...Ch. 14 - Muskogee Company had sales of 60,000,000 in 20x1....Ch. 14 - Javier Company has sales of 8 million and quality...Ch. 14 - In 20x4, Tru-Delite Frozen Desserts, Inc.,...Ch. 14 - Prob. 17ECh. 14 - Prob. 18ECh. 14 - Achieving sustainable development will likely...Ch. 14 - Classify the following environmental activities as...Ch. 14 - At the end of 20x5, Bing Pharmaceuticals began to...Ch. 14 - Prob. 22ECh. 14 - Coyle Pharmaceuticals produces two organic...Ch. 14 - Prob. 24ECh. 14 - Which of the following quality costs is an...Ch. 14 - Which of the following would be a hidden quality...Ch. 14 - Using the Taguchi quality loss function, an...Ch. 14 - Environmental costs are those costs incurred...Ch. 14 - Two products, Product A and Product B, are...Ch. 14 - Kathy Shorts, president of Oliver Company, was...Ch. 14 - Panguitch Company manufactures a component for...Ch. 14 - Gaston Company manufactures furniture. One of its...Ch. 14 - Classify the following quality costs as...Ch. 14 - Wayne Johnson, president of Banshee Company,...Ch. 14 - Recently, Ulrich Company received a report from an...Ch. 14 - In 20x5, Major Company initiated a full-scale,...Ch. 14 - Paper Products Division produces paper diapers,...Ch. 14 - In 2011, Milton Thayne, president of Carbondale...Ch. 14 - Iona Company, a large printing company, is in its...Ch. 14 - Prob. 40PCh. 14 - The following items are listed in an environmental...Ch. 14 - Refer to Problem 14.41. In the environmental...Ch. 14 - The following environmental cost reports for 20x3,...Ch. 14 - Refer to Problem 14.43. In 20x3, Jack Carter,...
Knowledge Booster


Learn more about
Need a deep-dive on the concept behind this application? Look no further. Learn more about this topic, accounting and related others by exploring similar questions and additional content below.Similar questions
- Bradshaw Company reported sales of 5,000,000 in 20X1. At the end of the fiscal year (June 30, 20X1), the following quality costs were reported: Required: 1. Prepare a quality cost report. 2. Prepare a graph (pie chart or bar graph) that shows the relative distribution of quality costs, and comment on the distribution. 3. Assuming sales of 5,000,000, by how much would profits increase if quality improves so that quality costs are only 3% of sales?arrow_forwardQuality Cost Report Loring Company had total sales of 2,400,000 for fiscal 20X1. The costs of quality-related activities are given below. Required: 1. Prepare a quality cost report, classifying costs by category and expressing each category as a percentage of sales. What message does the cost report provide? 2. Prepare a bar graph and pie chart that illustrate each categorys contribution to total quality costs. Comment on the significance of the distribution.arrow_forwardEvans Company had total sales of 3,000,000 for fiscal 20x5. The costs of quality-related activities are given below. Required: 1. Prepare a quality cost report, classifying costs by category and expressing each category as a percentage of sales. What message does the cost report provide? 2. Prepare a bar graph and pie chart that illustrate each categorys contribution to total quality costs. Comment on the significance of the distribution. 3. What if, five years from now, quality costs are 7.5 percent of sales, with control costs being 65 percent of the total quality costs? What would your conclusion be?arrow_forward
- Quality Cost Report Whitley Company had total sales of 1,000,000 for the year ending 20X1. The costs of quality are given below. Required: 1. Prepare a quality cost report, classifying costs by category and expressing each category as a percentage of sales. What message does the cost report provide? 2. Prepare a bar graph and pie chart that illustrate each categorys contribution to total quality costs. Comment on the significance of the distribution.arrow_forwardNorris Company implemented a quality improvement program and tracked the following for the 5 years: By cost category of sales for the same period of time: Required: 1. Prepare a bar graph (hat reveals the trend in quality cost as a percentage of sales (time on horizontal axis and percentages on the vertical). Comment on the message of the graph. 2. Prepare a bar graph for each cost category as a percentage of sales. What does this graph tell you?arrow_forwardPintura Company implemented a quality improvement program and tracked the following for the five years: By cost category as a percentage of sales for the same period of time: Required: 1. Prepare a bar graph that reveals the trend in quality cost as a percentage of sales (time on the horizontal axis and percentages on the vertical). Comment on the message of the graph. 2. Prepare a bar graph for each cost category as a percentage of sales. What does this graph tell you?arrow_forward
- Ross Company implemented a quality improvement program and tracked the following for the five years: By cost category as a percentage of sales for the same period of time: Required: 1. Prepare a bar graph that reveals the trend in quality cost as a percentage of sales (time on the horizontal axis and percentages on the vertical). Comment on the message of the graph. 2. Prepare a bar graph for each cost category as a percentage of sales. What does this graph tell you? 3. What if management would like to have the trend in relative distribution of quality costs? Express this as a bar graph and comment on its significance.arrow_forwardBelmain Co. expects to maintain the same inventories at the end of 20Y7 as at the beginning of the year. The total of all production costs for the year is therefore assumed to be equal to the cost of goods sold. With this in mind, the various department heads were asked to submit estimates of the costs for their departments during the year. A summary report of these estimates is as follows: EstimatedFixed Cost Estimated Variable Cost(per unit sold) Production costs: Direct materials $24 Direct labor 16 Factory overhead $365,000 12 Selling expenses: Sales salaries and commissions 75,800 5 Advertising 25,700 Travel 5,700 Miscellaneous selling expense 6,300 4 Administrative expenses: Office and officers' salaries 74,100 Supplies 9,100 2 Miscellaneous administrative expense 8,540 3 Total $570,240 $66 It is…arrow_forwardWalton Company has measured its quality costs for the past two years. After the company gathers its quality cost data, it summarizes those costs using the four categories shown below: Prevention costs Appraisal costs Internal failure costs Last Year $ 378,400 $ 440,600 This Year $ 591,500 $ 550,500 $ 813,700 $ 455,000 $ 1,144,000 $ 652,800 External failure costs Required: 1. Calculate the total cost of quality last year and this year. 2. For last year, calculate the cost in each of the four categories as a percent of the total cost of quality. 3. For this year, calculate the cost in each of the four categories as a percent of the total cost of quality. 4-a. Calculate the change in total cost of quality over the two-year period. 4-b. Is performance trending in a favorable or unfavorable direction? Complete this question by entering your answers in the tabs below. Required 1 Required 2 Required 3 Required 4A Required 4B Calculate the total cost of quality last year and this year. Total…arrow_forward
- Accounting Questionarrow_forwardWolsey Industries Inc. expects to maintain the same inventories at the end of 20Y8 as at the beginning of the year. The total of all production costs for the year is therefore assumed to be equal to the cost of goods sold. With this in mind, the various department heads were asked to submit estimates of the costs for their departments during the year A summary report of these estimates is as follows: Estimated Fixed Cost Estimated Variable Cost (per unit sold) 2 Production costs: 3 Direct materials 4 Direct labor 5 Factory overhead $56.00 36.00 $194,000.00 20.00 6 Selling expenses: 7 Sales salaries and commissions 110,000.00 8.00 8 Advertising 42,000.00 9 Travel 13,000.00 10 Miscellaneous selling expense 7,000.00 1.00 11 Administrative expenses: 12 Office and officers' salaries 13 Supplies 124,600.00 8,000.00 6.00arrow_forwardWalton Company has measured its quality costs for the past two years. After the company gathers its quality cost data, it summarizes those costs using the four categories shown below: Prevention costs Appraisal costs Internal failure costs External failure costs Required: 1. Calculate the total cost of quality last year and this year. 2. For last year, calculate the cost in each of the four categories as a percent of the total cost of quality. 3. For this year, calculate the cost in each of the four categories as a percent of the total cost of quality. 4-a. Calculate the change in total cost of quality over the two-year period. 4-b. Is performance trending in a favorable or unfavorable direction? Required 1 Last Year $ 353,400 $ 445,000 $ 766,300 $ 1,034,000 Complete this question by entering your answers in the tabs below. Required 2 Prevention costs Appraisal costs Internal failure costs External failure costs Total percent This Year $ 611,000 $ 528,700 $ 550,000 $ 714,000 Required 3…arrow_forward
arrow_back_ios
SEE MORE QUESTIONS
arrow_forward_ios
Recommended textbooks for you
 Cornerstones of Cost Management (Cornerstones Ser...AccountingISBN:9781305970663Author:Don R. Hansen, Maryanne M. MowenPublisher:Cengage Learning
 Managerial Accounting: The Cornerstone of Busines...AccountingISBN:9781337115773Author:Maryanne M. Mowen, Don R. Hansen, Dan L. HeitgerPublisher:Cengage Learning
 Financial And Managerial AccountingAccountingISBN:9781337902663Author:WARREN, Carl S.Publisher:Cengage Learning,
 Managerial AccountingAccountingISBN:9781337912020Author:Carl Warren, Ph.d. Cma William B. TaylerPublisher:South-Western College Pub
 Principles of Accounting Volume 2AccountingISBN:9781947172609Author:OpenStaxPublisher:OpenStax College
Cornerstones of Cost Management (Cornerstones Ser...
Accounting
ISBN:9781305970663
Author:Don R. Hansen, Maryanne M. Mowen
Publisher:Cengage Learning
Managerial Accounting: The Cornerstone of Busines...
Accounting
ISBN:9781337115773
Author:Maryanne M. Mowen, Don R. Hansen, Dan L. Heitger
Publisher:Cengage Learning
Financial And Managerial Accounting
Accounting
ISBN:9781337902663
Author:WARREN, Carl S.
Publisher:Cengage Learning,
Managerial Accounting
Accounting
ISBN:9781337912020
Author:Carl Warren, Ph.d. Cma William B. Tayler
Publisher:South-Western College Pub
Principles of Accounting Volume 2
Accounting
ISBN:9781947172609
Author:OpenStax
Publisher:OpenStax College
Inspection and Quality control in Manufacturing. What is quality inspection?; Author: Educationleaves;https://www.youtube.com/watch?v=Ey4MqC7Kp7g;License: Standard youtube license