
Introductory Statistics (10th Edition)
10th Edition
ISBN: 9780321989178
Author: Neil A. Weiss
Publisher: PEARSON
expand_more
expand_more
format_list_bulleted
Concept explainers
Videos
Textbook Question
Chapter 14.2, Problem 42E
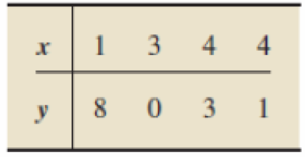
In each of Exercises 14.42–14.45, we have presented two linear equations and a set of data points. For each exercise,
- a. plot the data points and the first linear equation on one graph and the data points and the second linear equation on another.
- b. construct tables for x, y, ŷ, e, and e2 like Table 14.4 (page 626).
- c. determine which line fits the set of data points better, according to the least-squares criterion.
14.42 Line A: y = 9 - 2x, Line B: y = 6 - x
Data points:
Expert Solution & Answer
Want to see the full answer?
Check out a sample textbook solution
Students have asked these similar questions
The following table gives the total number, in thousands, of illegal alien apprehensions at the SouthwesternUS-Mexico border. The data is provided by the United States Border Control.Year 2000 2004 2008 2010 2012 2014 2016 2018 2019# apps 1643 1139 705 447 356 479 409 397 852a) Let x be the number of years since 2000 and A the number of southwestern border apprehensions in 1000’s.Use the data for the years 2000 and 2019 to write an equation of a linear model relating x and A.round all values to the nearest thousand.
The following chart is data over an 8-month period that shows how much a company spent in advertising and the sales revenue for that month
MONTH
ADVERTISING $
SALES $
March
900
56000
April
2700
89200
May
3150
98500
June
1300
54000
July
3400
97000
Aug
1500
56000
Sept
2300
93000
Oct
2250
79000
What is the linear equation (y = mx + b form) that best approximates the relationship between advertising dollars spent(x) and sales revenue(y) based on the above 8 months of data? (round to 2 decimals for the slope and the y intercept) describe how you utilized excel to arrive at this equation
The table below shows the number of state-registered automatic weapons and the murder rate for several Northwestern states.
x
11.9
8.6
7.1
3.8
2.3
2.3
2.2
0.3
y
14.3
11
9.9
7.3
5.7
5.7
5.6
4.1
x = thousands of automatic weaponsy = murders per 100,000 residentsThis data can be modeled by the equation y=0.87x+3.75. Use this equation to answer the following; Special Note: I suggest you verify this equation by performing linear regression on your calculator.A) How many murders per 100,000 residents can be expected in a state with 5 thousand automatic weapons?Answer = Round to 3 decimal places.B) How many murders per 100,000 residents can be expected in a state with 10.5 thousand automatic weapons?Answer = Round to 3 decimal places.
Chapter 14 Solutions
Introductory Statistics (10th Edition)
Ch. 14.1 - Regarding linear equations with one independent...Ch. 14.1 - Prob. 2ECh. 14.1 - Consider the linear equation y = b0 + b1x. a....Ch. 14.1 - Prob. 4ECh. 14.1 - In Exercises 14.514.14, we give linear equations....Ch. 14.1 - Prob. 6ECh. 14.1 - In Exercises 14.5-14.14, we give linear equations....Ch. 14.1 - Prob. 8ECh. 14.1 - Prob. 9ECh. 14.1 - In Exercises 14.514.14, we give linear equations....
Ch. 14.1 - Prob. 11ECh. 14.1 - Prob. 12ECh. 14.1 - Prob. 13ECh. 14.1 - Prob. 14ECh. 14.1 - In Exercises 14.1514.22,we identify the...Ch. 14.1 - Prob. 16ECh. 14.1 - Prob. 17ECh. 14.1 - Prob. 18ECh. 14.1 - Prob. 19ECh. 14.1 - Prob. 20ECh. 14.1 - Prob. 21ECh. 14.1 - Prob. 22ECh. 14.1 - Rental-Car Costs. During one month, the Avis...Ch. 14.1 - Air-Conditioning Repairs. Richards Healing and...Ch. 14.1 - Measuring Temperature. The two most commonly used...Ch. 14.1 - A Law of Physics. A ball is thrown straight up in...Ch. 14.1 - Prob. 27ECh. 14.1 - Prob. 28ECh. 14.1 - Prob. 29ECh. 14.1 - Prob. 30ECh. 14.1 - Prob. 31ECh. 14.1 - Road Grade. The grade of a road is defined as the...Ch. 14.1 - Vertical Lines. In this section, we stated that...Ch. 14.2 - Regarding a scatterplot, a. identify one of its...Ch. 14.2 - Regarding the criterion used to decide on the line...Ch. 14.2 - Regarding the line that best fits a set of data...Ch. 14.2 - Regarding the two variables under consideration in...Ch. 14.2 - Using the regression equation to make predictions...Ch. 14.2 - Fill in the blanks. a. In the context of...Ch. 14.2 - For which of the following sets of data points can...Ch. 14.2 - For which of the following sets of data points can...Ch. 14.2 - In each of Exercises 14.4214.45, we have presented...Ch. 14.2 - In each of Exercises 14.4214.45, we have presented...Ch. 14.2 - In each of Exercises 14.4214.45, we have presented...Ch. 14.2 - In each of Exercises 14.4214.45, we have presented...Ch. 14.2 - For a data set consisting of two data points: a....Ch. 14.2 - Prob. 47ECh. 14.2 - In each of Exercises 14.4814.57, a. find the...Ch. 14.2 - In each of Exercises 14.4814.57. a. find the...Ch. 14.2 - In each of Exercises 14.4814.57, a. find the...Ch. 14.2 - In each of Exercises 14.48-14.57, a. find the...Ch. 14.2 - In each of Exercises 14.4814.57, a. find the...Ch. 14.2 - In each of Exercises 14.4814.57, a. find the...Ch. 14.2 - In each of Exercises 14.48-14.57, a. find the...Ch. 14.2 - In each of Exercises 14.4814.57. a. find the...Ch. 14.2 - In each of Exercises 14.4814.57. a. find the...Ch. 14.2 - In each of Exercises 14.4814.57. a. find the...Ch. 14.2 - Prob. 58ECh. 14.2 - In each of Exercises 14.5814.63, a. find the...Ch. 14.2 - In each of Exercises 14.5814.63. a. find the...Ch. 14.2 - In each of Exercises 14.5814.63, a. find the...Ch. 14.2 - In each of Exercises 14.5814.63. a. find the...Ch. 14.2 - In each of Exercises 14.5814.63, a. find the...Ch. 14.2 - Tax Efficiency. In Exercise 14.58, you determined...Ch. 14.2 - Corvette Prices. In Exercise 14.59, you determined...Ch. 14.2 - Anscombes Quartet. In the article Graphs in...Ch. 14.2 - Study Time and Score. The negative relation...Ch. 14.2 - Age and Price of Orions. In Table 14.2, we...Ch. 14.2 - Wasp Mating Systems. In the paper "Mating System...Ch. 14.2 - In Exercises 14.7014.80, use the technology of...Ch. 14.2 - In Exercises 14.7014.80, use the technology of...Ch. 14.2 - In Exercises 14.7014.80, use the technology of...Ch. 14.2 - In Exercises I4.7014.80, use the technology of...Ch. 14.2 - In Exercises 14.7014.80, use the technology of...Ch. 14.2 - In Exercises 14.7014.80, use the technology of...Ch. 14.2 - Prob. 76ECh. 14.2 - Prob. 77ECh. 14.2 - Prob. 78ECh. 14.2 - Prob. 79ECh. 14.2 - In Exercises 14.7014.80, use the technology of...Ch. 14.2 - Prob. 81ECh. 14.2 - Time Series. A collection of observations of a...Ch. 14.3 - In this section, we introduced a descriptive...Ch. 14.3 - A measure of total variation in the observed...Ch. 14.3 - A measure of the amount of variation in the...Ch. 14.3 - A measure of the amount of variation in the...Ch. 14.3 - Prob. 87ECh. 14.3 - In Exercises 14.8814.97, we repeal the data and...Ch. 14.3 - In Exercises14.481497, we repeal the tiara and...Ch. 14.3 - In Exercises 14.8814.97, we repeat the data and...Ch. 14.3 - Prob. 91ECh. 14.3 - Prob. 92ECh. 14.3 - Prob. 93ECh. 14.3 - Prob. 94ECh. 14.3 - Prob. 95ECh. 14.3 - Prob. 96ECh. 14.3 - Prob. 97ECh. 14.3 - Applying the Concepts and Skills For Exercises...Ch. 14.3 - Prob. 99ECh. 14.3 - Prob. 100ECh. 14.3 - Prob. 101ECh. 14.3 - Prob. 102ECh. 14.3 - For Exercises 14.9814.103, a. compute SST, SSR,...Ch. 14.3 - Prob. 104ECh. 14.3 - In Exercises 14.10414.115, use the technology of...Ch. 14.3 - Prob. 106ECh. 14.3 - Prob. 107ECh. 14.3 - Prob. 108ECh. 14.3 - Prob. 109ECh. 14.3 - Prob. 110ECh. 14.3 - Prob. 111ECh. 14.3 - Prob. 112ECh. 14.3 - Prob. 113ECh. 14.3 - In Exercises 14.10414.115, use the technology of...Ch. 14.3 - In Exercises 14.10414.115, use the technology of...Ch. 14.3 - What can you say about SSE, SSR, and the utility...Ch. 14.3 - As we noted, because of the regression identity,...Ch. 14.4 - What is one purpose of the linear correlation...Ch. 14.4 - Prob. 119ECh. 14.4 - The symbol that is used for the linear correlation...Ch. 14.4 - A value of r close to 1 indicates that there is a...Ch. 14.4 - A value of r close to ____ indicates that there is...Ch. 14.4 - A value of r close to ____ indicates that the...Ch. 14.4 - A value of r close to 0 indicates that the...Ch. 14.4 - If y tends to increase linearly as x increases,...Ch. 14.4 - If y lends to decrease linearly as x increases,...Ch. 14.4 - If there is no linear relationship between x and...Ch. 14.4 - In each of Exercises 14.12814.130, determine...Ch. 14.4 - In each of Exercises 14.12814.130, determine...Ch. 14.4 - In each of Exercises 14.12814.130, determine...Ch. 14.4 - Answer true or false to the following statement...Ch. 14.4 - The linear correlation coefficient of a set of...Ch. 14.4 - The coefficient of determination of a set of data...Ch. 14.4 - In Exercises 14.13414.143, we repeat data from...Ch. 14.4 - In Exercises 14.13414.143, we repeat data from...Ch. 14.4 - In Exercises 14.13414.143, we repeat data front...Ch. 14.4 - Prob. 137ECh. 14.4 - In Exercises 14.13414.143, we repeat data from...Ch. 14.4 - In Exercises 14.13414.143, we repeat data from...Ch. 14.4 - In Exercises 14.13414.143, we repeat data from...Ch. 14.4 - In Exercises 14.13414.143, we repeat data from...Ch. 14.4 - In Exercises 14.13414.143, we repeat data from...Ch. 14.4 - In Exercises 14.13414.143, we repeat data from...Ch. 14.4 - In Exercises 14.14414.149, we repeat data from...Ch. 14.4 - In Exercises 14.14414.149, we repeat data from...Ch. 14.4 - In Exercises 14.14414.149, we repeat data from...Ch. 14.4 - Prob. 147ECh. 14.4 - In Exercises 14.14414.149, we repeat data from...Ch. 14.4 - In Exercises 14.14414.149, we repeat data from...Ch. 14.4 - Height and Score. A random sample of 10 students...Ch. 14.4 - Prob. 151ECh. 14.4 - Prob. 152ECh. 14.4 - Prob. 153ECh. 14.4 - Prob. 154ECh. 14.4 - In Exercise 14.154-14.166, use the technology of...Ch. 14.4 - Prob. 156ECh. 14.4 - Prob. 157ECh. 14.4 - Prob. 158ECh. 14.4 - Prob. 159ECh. 14.4 - Prob. 160ECh. 14.4 - Prob. 161ECh. 14.4 - In Exercises 14.154-14.166, use the technology of...Ch. 14.4 - In Exercises 14.15414.166, use the technology of...Ch. 14.4 - Prob. 164ECh. 14.4 - Prob. 165ECh. 14.4 - In Exercises 14.154-14.166, use the technology of...Ch. 14.4 - The coefficient of determination of a set of data...Ch. 14.4 - Country Music Blues. A Knight-Ridder News Service...Ch. 14.4 - Prob. 169ECh. 14.4 - In each of Exercises 14.169 and 14.170, a....Ch. 14 - For a linear equation y = b0 + b1x, identify the ...Ch. 14 - Consider the linear equation y = 4-3x. a. At what...Ch. 14 - In Problems 35, answer true or false to each...Ch. 14 - In Problems 35, answer true or false to each...Ch. 14 - In Problems 35, answer true or false to each...Ch. 14 - Prob. 6RPCh. 14 - In Problems 35, answer true or false to each...Ch. 14 - Prob. 8RPCh. 14 - In each of Problems 911, fill in the blank. 9....Ch. 14 - Prob. 10RPCh. 14 - Prob. 11RPCh. 14 - Prob. 12RPCh. 14 - Prob. 13RPCh. 14 - Prob. 14RPCh. 14 - Prob. 15RPCh. 14 - Prob. 16RPCh. 14 - Prob. 17RPCh. 14 - Prob. 18RPCh. 14 - Prob. 19RPCh. 14 - Equipment Depreciation. A small company has...Ch. 14 - Graduation Rates. Graduation ratethe percentage of...Ch. 14 - Graduation Rates. Refer to Problem 21. a....Ch. 14 - Graduation Rates. Refer to Problem 21. a. Compute...Ch. 14 - Exotic Plants. In the article Effects of Human...Ch. 14 - In Problems 2527, use the technology of your...Ch. 14 - Prob. 26RPCh. 14 - Prob. 27RPCh. 14 - Recall from Chapter 1 (see page 34) that the Focus...Ch. 14 - At the beginning of this chapter, we presented...
Knowledge Booster


Learn more about
Need a deep-dive on the concept behind this application? Look no further. Learn more about this topic, statistics and related others by exploring similar questions and additional content below.Similar questions
- Use the result in Exercise 20 to find the equation of the line that contains 5,-1 and is parallel to the graph of 3x-4y=12.arrow_forwardThe table below shows the number of state-registered automatic weapons and the murder rate for several Northwestern states. x 11.5 8.5 6.7 3.8 2.6 2.5 2.3 0.4 y 13.9 11.4 9.5 7.1 6.3 6.2 6.1 4.2 x = thousands of automatic weaponsy = murders per 100,000 residents This data can be modeled by the equation y=0.86x+3.96. Use this equation to answer the following; Special Note: I suggest you verify this equation by performing linear regression on your calculator. A) How many murders per 100,000 residents can be expected in a state with 1.8 thousand automatic weapons? Answer = Round to 3 decimal places. B) How many murders per 100,000 residents can be expected in a state with 9.7 thousand automatic weapons? Answer = Round to 3 decimal places.arrow_forwardThe consumer price index(CPI), which measures the cost of a typical package of consumer goods was 201.6 in the year 2006 and 224.9 in the year 2011. let x=6 correspond to 2006. Use the two data points provided to find a linear equationarrow_forward
- Given the “data” determined by y = x^3 + (x-1)^2 with x = 0.1, 1.2, 2.3, and 2.9, calculate SSTO, SSR, and R^2. Then recalculate these using x = 0.3, 1, 2.45, and 2.8. Does where you collect your data (i.e., which values of x) appear to impact your interpretation of how good the linear model fits?.arrow_forwardThe data in the following table show five students' reading test scores and final exam grades in a history class. Reading Test Score, x 8.5 9.4 10.0 11.4 12.0 History Final Exam Grade, y 62 68 74 87 92 (a) Use the points (8.5, 62) and (10.0, 74) to find a linear model that will predict a student's final exam grade, y, given his or her reading test score, x. y = (b) Use your linear model to estimate a student's final exam grade in the history class given that the student's reading test score was 9.5.arrow_forward1. The following chart is data over an 8 month period that shows how much a company spent in advertising and the sales revenue for that month MONTH ADVERTISING $ SALES $ March 900 56000 April 2700 89200 May 3150 98500 June 1300 54000 July 3400 97000 Aug 1500 56000 Sept 2300 93000 Oct 2250 79000 d) What is the linear equation (y = mx + b form) that best approximates the relationship between advertising dollars spent(x) and sales revenue(y) based on the above 8 months of data? (round to 2 decimals for the slope and the y intercept) describe how you utilized excel to arrive at this equation (recommended) or show the formula you utilized to arrive at your equation e) What sales revenue would the company expect for the following advertising spending? Round to nearest centshow calculation a) 3000 b) 2100 c) 1300 f) If you were in charge of the…arrow_forward
- The data in the table below are not linear, but if we omit the first point, the remaining data are linear. Make a linear model for these last three points. (Enter your answer in terms of x.) x -1 1 3 5 y 3 8 14 20arrow_forwardFor the past several years, the state prison system has been concentrating on getting inmates who were high school dropouts help in both earning their GED (an alternative to a high school diploma) and training in trades such as plumbing, carpentry, electrical work, and so on. The state director of prisons has noticed that for participants in the program over the past 9 years, the recidivism rate (in %) has been dropping. She determines that it has a linear relationship, ŷ = 75.12 − 6.03x,where ŷ = predicted recidivism rate and x = numberof years the program has been implemented. What recidivism rate (in %) does the director of prisons expect during the 10th year of the program?arrow_forwardA cell phone company offers aninternational plan by charging $30 for the first 80 minutes, plus$0.50 for each minute over 80.(a) Write a linear model that relates the cost C, in dollars, oftalking x minutes, assuming x ≥ 80.(b) What is the cost of talking 105 minutes? 120 minutes?arrow_forward
arrow_back_ios
arrow_forward_ios
Recommended textbooks for you
 Elementary Geometry For College Students, 7eGeometryISBN:9781337614085Author:Alexander, Daniel C.; Koeberlein, Geralyn M.Publisher:Cengage,
 Linear Algebra: A Modern IntroductionAlgebraISBN:9781285463247Author:David PoolePublisher:Cengage Learning
Elementary Geometry For College Students, 7e
Geometry
ISBN:9781337614085
Author:Alexander, Daniel C.; Koeberlein, Geralyn M.
Publisher:Cengage,
Linear Algebra: A Modern Introduction
Algebra
ISBN:9781285463247
Author:David Poole
Publisher:Cengage Learning
Correlation Vs Regression: Difference Between them with definition & Comparison Chart; Author: Key Differences;https://www.youtube.com/watch?v=Ou2QGSJVd0U;License: Standard YouTube License, CC-BY
Correlation and Regression: Concepts with Illustrative examples; Author: LEARN & APPLY : Lean and Six Sigma;https://www.youtube.com/watch?v=xTpHD5WLuoA;License: Standard YouTube License, CC-BY