
Concept explainers
Videos
In each of Exercises 14.58–14.63,
- a. find the regression equation for the data points.
- b. graph the regression equation and the data points.
- c. describe the apparent relationship between the two variables under consideration.
- d. interpret the slope of the regression line.
- e. identify the predictor and response variables.
- f. identify outliers and potential influential observations.
- g. predict the values of the response variable for the specified values of the predictor variable, and interpret your results.
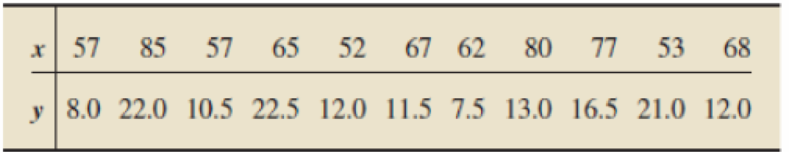
14.61 Plant Emissions. Plants emit gases that trigger the ripening of fruit, attract pollinators, and cue other physiological responses. N. Agelopolous et al. examined factors that affect the emission of volatile compounds by the potato plant Solanum tuberosum and published their findings in the paper “Factors Affecting Volatile Emissions of Intact Potato Plants, Solanum tuberosum: Variability of Quantities and Stability of Ratios” (Journal of Chemical Ecology, Vol. 26, No. 2, pp. 497–511). The volatile compounds analyzed were hydrocarbons used by other plants and animals. Following are data on plant weight (X), in grams, and quantity of volatile compounds emitted (y), in hundreds of nanograms, for 11 potato plants. For pan (g), predict the quantity of volatile compounds emitted by a potato plant that weighs 75 grams.
Want to see the full answer?
Check out a sample textbook solution
Chapter 14 Solutions
Introductory Statistics (10th Edition)


- Life Expectancy The following table shows the average life expectancy, in years, of a child born in the given year42 Life expectancy 2005 77.6 2007 78.1 2009 78.5 2011 78.7 2013 78.8 a. Find the equation of the regression line, and explain the meaning of its slope. b. Plot the data points and the regression line. c. Explain in practical terms the meaning of the slope of the regression line. d. Based on the trend of the regression line, what do you predict as the life expectancy of a child born in 2019? e. Based on the trend of the regression line, what do you predict as the life expectancy of a child born in 1580?2300arrow_forwardOlympic Pole Vault The graph in Figure 7 indicates that in recent years the winning Olympic men’s pole vault height has fallen below the value predicted by the regression line in Example 2. This might have occurred because when the pole vault was a new event there was much room for improvement in vaulters’ performances, whereas now even the best training can produce only incremental advances. Let’s see whether concentrating on more recent results gives a better predictor of future records. (a) Use the data in Table 2 (page 176) to complete the table of winning pole vault heights shown in the margin. (Note that we are using x=0 to correspond to the year 1972, where this restricted data set begins.) (b) Find the regression line for the data in part ‚(a). (c) Plot the data and the regression line on the same axes. Does the regression line seem to provide a good model for the data? (d) What does the regression line predict as the winning pole vault height for the 2012 Olympics? Compare this predicted value to the actual 2012 winning height of 5.97 m, as described on page 177. Has this new regression line provided a better prediction than the line in Example 2?arrow_forwardThe following fictitious table shows kryptonite price, in dollar per gram, t years after 2006. t= Years since 2006 0 1 2 3 4 5 6 7 8 9 10 K= Price 56 51 50 55 58 52 45 43 44 48 51 Make a quartic model of these data. Round the regression parameters to two decimal places.arrow_forward
- The ordered pairs below give the median sales prices y (in thousands of dollars) of new homes sold in a neighborhood from 2009 through 2016. (2009, 179.4) (2011, 191.0) (2013, 202.6) (2015, 214.9) (2010, 185.4) (2012, 196.7) (2014, 208.7) (2016, 221.4) A linear model that approximates the data is y=5.96t+125.5,9t16, where t represents the year, with t=9 corresponding to 2009. Plot the actual data and the model on the same graph. How closely does the model represent the data?arrow_forwardThe following data set shows the entrance exam score (Verbal GMAT) for each of eight MBA students along with his or her grade point average (GPA) upon graduation. Calculate the slope and y-intercept for the linear regression equation for these data. GMAT 320 290 250 290 340 270 290 290 GPA 3.7 3.1 3.1 3.1 3.8 2.9 3.6 2.9arrow_forwardFind the slope of the equation of the regression line for the following data: Consumer Price Index(X) 30.2 48.3 112.3 162.2 191.9 197.8 Cost of Pizza(Y) 0.15 0.35 1.00 1.25 1.75 2.00arrow_forward
- Midgett Co. has accumulated data to use in preparing its annual profit plan for the upcoming year. The cost behavior pattern of the maintenance costs must be determined. The accounting staff suggested that linear regression be employed to derive an equation for maintenance hours and costs. Data regarding the maintenance hours and costs for the last year and the results of the regression analysis are as follows: Month MaintenanceCost Machine Hours Jan. $ 5,000 600 Feb. 3,644 440 Mar. 4,400 610 Apr. 3,337 480 May 5,222 660 June 3,390 410 July 3,618 470 Aug. 5,384 630 Sept. 5,114 590 Oct. 4,883 590 Nov. 3,925 430 Dec. 3,850 350 Sum $ 51,767 6,260 Average $ 4,313.92 521.67 Average cost per hour ($51,767/6,260) = $8.27 (rounded to the nearest cent) r = 0.85977 r2 = 0.73920 The percent of the total variance that…arrow_forwardIn order to determine a realistic price for a new product that a company wants to market the company’s research department selected 10 sites thought to have essentially identical sales potential and offered the product in each at a different price. The resulting sales are recorded in the accompanying table: Price ($) Sales ($1,000s) 15.00 15 15.50 14 16.00 16 16.50 9 17.00 12 17.50 10 18.00 8 18.50 9 19.00 6 19.50 5 h). Estimate the slope of the actual equation of the regression line using a 95% confidence interval and interpret this interval.arrow_forwardFind the slope of the equation of the regression line for the following data: Consumer Price Index 30.2 48.3 112.3 162.2 191.9 197.8 Cost of Pizza 0.15 0.35 1.00 1.25 1.75 2.00arrow_forward
 Algebra and Trigonometry (MindTap Course List)AlgebraISBN:9781305071742Author:James Stewart, Lothar Redlin, Saleem WatsonPublisher:Cengage Learning
 Functions and Change: A Modeling Approach to Coll...AlgebraISBN:9781337111348Author:Bruce Crauder, Benny Evans, Alan NoellPublisher:Cengage Learning
 College AlgebraAlgebraISBN:9781305115545Author:James Stewart, Lothar Redlin, Saleem WatsonPublisher:Cengage Learning
 Glencoe Algebra 1, Student Edition, 9780079039897...AlgebraISBN:9780079039897Author:CarterPublisher:McGraw Hill