
Introductory Statistics (10th Edition)
10th Edition
ISBN: 9780321989178
Author: Neil A. Weiss
Publisher: PEARSON
expand_more
expand_more
format_list_bulleted
Concept explainers
Videos
Textbook Question
Chapter 14.2, Problem 55E
In each of Exercises 14.48–14.57.
- a. find the regression equation for the data points. Use the defining formulas in Definition 14.4 to obtain Sxx and Sxy.
- b. graph the regression equation and the data points.
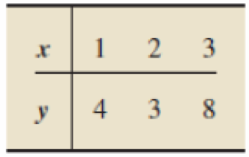
14.55 The data points in Exercise 14.43
In each of Exercises 14.42–14.45, we have presented two linear equations and a set of data points. For each exercise,
- a. plot the data points and the first linear equation on one graph and the data points and the second linear equation on another.
- b. construct tables for x, y, ŷ, e, and e2 like Table 14.4 (page 626).
- c. determine which line fits the set of data points better, according to the least-squares criterion.
14.43 Line A: y = - 1 + 3x, Line B: y = 1 + 2x
Data points:
Expert Solution & Answer
Want to see the full answer?
Check out a sample textbook solution
Students have asked these similar questions
Use the following linear regression equation to answer the questions.
x1 = 1.5 + 3.6x2 – 7.8x3 + 1.8x4
(c) If x2 = 10, x3 = 7, and x4 = 7, what is the predicted value for x1? (Use 1 decimal place.) answer: -4.5
Suppose x3 and x4 were held at fixed but arbitrary values and x2 increased by 1 unit. What would be the corresponding change in x1? answer:3.6 Suppose x2 increased by 2 units. What would be the expected change in x1? answer: 7.2 Suppose x2 decreased by 4 units. What would be the expected change in x1?
(e) Suppose that n = 13 data points were used to construct the given regression equation and that the standard error for the coefficient of x2 is 0.461. Construct a 95% confidence interval for the coefficient of x2. (Use 2 decimal places.)
lower limit
upper limit
(f) Using the information of part (e) and level of significance 1%, test the claim that the coefficient of x2 is different from zero. (Use 2 decimal places.)
t
7.81
t critical ±
Assume there is a positive linear correlation between the variable R (Return rate in percent of a financial investment) and the variable t (age in years of the investment) given by the regression equation R= 2.3t + 4.8
A. Without further information, can we assume there is a cause-and-effect relationship between the return rate and the age of the investment?
B. If the investment continues to grow at a constant rate, what is the expeted return rate when the investment is 7 years old?
C. If the investment continues to grow at a constant rate, how old is the investment when the return rate is 30%?
Use the following linear regression equation to answer the questions.
x1 = 2.0 + 3.6x2 – 7.8x3 + 2.1x4
a) Suppose x3 and x4 were held at fixed but arbitrary values and x2 increased by 1 unit. What would be the corresponding change in x1?b) Suppose x2 increased by 2 units. What would be the expected change in x1?c) Suppose x2 decreased by 4 units. What would be the expected change in x1?
Chapter 14 Solutions
Introductory Statistics (10th Edition)
Ch. 14.1 - Regarding linear equations with one independent...Ch. 14.1 - Prob. 2ECh. 14.1 - Consider the linear equation y = b0 + b1x. a....Ch. 14.1 - Prob. 4ECh. 14.1 - In Exercises 14.514.14, we give linear equations....Ch. 14.1 - Prob. 6ECh. 14.1 - In Exercises 14.5-14.14, we give linear equations....Ch. 14.1 - Prob. 8ECh. 14.1 - Prob. 9ECh. 14.1 - In Exercises 14.514.14, we give linear equations....
Ch. 14.1 - Prob. 11ECh. 14.1 - Prob. 12ECh. 14.1 - Prob. 13ECh. 14.1 - Prob. 14ECh. 14.1 - In Exercises 14.1514.22,we identify the...Ch. 14.1 - Prob. 16ECh. 14.1 - Prob. 17ECh. 14.1 - Prob. 18ECh. 14.1 - Prob. 19ECh. 14.1 - Prob. 20ECh. 14.1 - Prob. 21ECh. 14.1 - Prob. 22ECh. 14.1 - Rental-Car Costs. During one month, the Avis...Ch. 14.1 - Air-Conditioning Repairs. Richards Healing and...Ch. 14.1 - Measuring Temperature. The two most commonly used...Ch. 14.1 - A Law of Physics. A ball is thrown straight up in...Ch. 14.1 - Prob. 27ECh. 14.1 - Prob. 28ECh. 14.1 - Prob. 29ECh. 14.1 - Prob. 30ECh. 14.1 - Prob. 31ECh. 14.1 - Road Grade. The grade of a road is defined as the...Ch. 14.1 - Vertical Lines. In this section, we stated that...Ch. 14.2 - Regarding a scatterplot, a. identify one of its...Ch. 14.2 - Regarding the criterion used to decide on the line...Ch. 14.2 - Regarding the line that best fits a set of data...Ch. 14.2 - Regarding the two variables under consideration in...Ch. 14.2 - Using the regression equation to make predictions...Ch. 14.2 - Fill in the blanks. a. In the context of...Ch. 14.2 - For which of the following sets of data points can...Ch. 14.2 - For which of the following sets of data points can...Ch. 14.2 - In each of Exercises 14.4214.45, we have presented...Ch. 14.2 - In each of Exercises 14.4214.45, we have presented...Ch. 14.2 - In each of Exercises 14.4214.45, we have presented...Ch. 14.2 - In each of Exercises 14.4214.45, we have presented...Ch. 14.2 - For a data set consisting of two data points: a....Ch. 14.2 - Prob. 47ECh. 14.2 - In each of Exercises 14.4814.57, a. find the...Ch. 14.2 - In each of Exercises 14.4814.57. a. find the...Ch. 14.2 - In each of Exercises 14.4814.57, a. find the...Ch. 14.2 - In each of Exercises 14.48-14.57, a. find the...Ch. 14.2 - In each of Exercises 14.4814.57, a. find the...Ch. 14.2 - In each of Exercises 14.4814.57, a. find the...Ch. 14.2 - In each of Exercises 14.48-14.57, a. find the...Ch. 14.2 - In each of Exercises 14.4814.57. a. find the...Ch. 14.2 - In each of Exercises 14.4814.57. a. find the...Ch. 14.2 - In each of Exercises 14.4814.57. a. find the...Ch. 14.2 - Prob. 58ECh. 14.2 - In each of Exercises 14.5814.63, a. find the...Ch. 14.2 - In each of Exercises 14.5814.63. a. find the...Ch. 14.2 - In each of Exercises 14.5814.63, a. find the...Ch. 14.2 - In each of Exercises 14.5814.63. a. find the...Ch. 14.2 - In each of Exercises 14.5814.63, a. find the...Ch. 14.2 - Tax Efficiency. In Exercise 14.58, you determined...Ch. 14.2 - Corvette Prices. In Exercise 14.59, you determined...Ch. 14.2 - Anscombes Quartet. In the article Graphs in...Ch. 14.2 - Study Time and Score. The negative relation...Ch. 14.2 - Age and Price of Orions. In Table 14.2, we...Ch. 14.2 - Wasp Mating Systems. In the paper "Mating System...Ch. 14.2 - In Exercises 14.7014.80, use the technology of...Ch. 14.2 - In Exercises 14.7014.80, use the technology of...Ch. 14.2 - In Exercises 14.7014.80, use the technology of...Ch. 14.2 - In Exercises I4.7014.80, use the technology of...Ch. 14.2 - In Exercises 14.7014.80, use the technology of...Ch. 14.2 - In Exercises 14.7014.80, use the technology of...Ch. 14.2 - Prob. 76ECh. 14.2 - Prob. 77ECh. 14.2 - Prob. 78ECh. 14.2 - Prob. 79ECh. 14.2 - In Exercises 14.7014.80, use the technology of...Ch. 14.2 - Prob. 81ECh. 14.2 - Time Series. A collection of observations of a...Ch. 14.3 - In this section, we introduced a descriptive...Ch. 14.3 - A measure of total variation in the observed...Ch. 14.3 - A measure of the amount of variation in the...Ch. 14.3 - A measure of the amount of variation in the...Ch. 14.3 - Prob. 87ECh. 14.3 - In Exercises 14.8814.97, we repeal the data and...Ch. 14.3 - In Exercises14.481497, we repeal the tiara and...Ch. 14.3 - In Exercises 14.8814.97, we repeat the data and...Ch. 14.3 - Prob. 91ECh. 14.3 - Prob. 92ECh. 14.3 - Prob. 93ECh. 14.3 - Prob. 94ECh. 14.3 - Prob. 95ECh. 14.3 - Prob. 96ECh. 14.3 - Prob. 97ECh. 14.3 - Applying the Concepts and Skills For Exercises...Ch. 14.3 - Prob. 99ECh. 14.3 - Prob. 100ECh. 14.3 - Prob. 101ECh. 14.3 - Prob. 102ECh. 14.3 - For Exercises 14.9814.103, a. compute SST, SSR,...Ch. 14.3 - Prob. 104ECh. 14.3 - In Exercises 14.10414.115, use the technology of...Ch. 14.3 - Prob. 106ECh. 14.3 - Prob. 107ECh. 14.3 - Prob. 108ECh. 14.3 - Prob. 109ECh. 14.3 - Prob. 110ECh. 14.3 - Prob. 111ECh. 14.3 - Prob. 112ECh. 14.3 - Prob. 113ECh. 14.3 - In Exercises 14.10414.115, use the technology of...Ch. 14.3 - In Exercises 14.10414.115, use the technology of...Ch. 14.3 - What can you say about SSE, SSR, and the utility...Ch. 14.3 - As we noted, because of the regression identity,...Ch. 14.4 - What is one purpose of the linear correlation...Ch. 14.4 - Prob. 119ECh. 14.4 - The symbol that is used for the linear correlation...Ch. 14.4 - A value of r close to 1 indicates that there is a...Ch. 14.4 - A value of r close to ____ indicates that there is...Ch. 14.4 - A value of r close to ____ indicates that the...Ch. 14.4 - A value of r close to 0 indicates that the...Ch. 14.4 - If y tends to increase linearly as x increases,...Ch. 14.4 - If y lends to decrease linearly as x increases,...Ch. 14.4 - If there is no linear relationship between x and...Ch. 14.4 - In each of Exercises 14.12814.130, determine...Ch. 14.4 - In each of Exercises 14.12814.130, determine...Ch. 14.4 - In each of Exercises 14.12814.130, determine...Ch. 14.4 - Answer true or false to the following statement...Ch. 14.4 - The linear correlation coefficient of a set of...Ch. 14.4 - The coefficient of determination of a set of data...Ch. 14.4 - In Exercises 14.13414.143, we repeat data from...Ch. 14.4 - In Exercises 14.13414.143, we repeat data from...Ch. 14.4 - In Exercises 14.13414.143, we repeat data front...Ch. 14.4 - Prob. 137ECh. 14.4 - In Exercises 14.13414.143, we repeat data from...Ch. 14.4 - In Exercises 14.13414.143, we repeat data from...Ch. 14.4 - In Exercises 14.13414.143, we repeat data from...Ch. 14.4 - In Exercises 14.13414.143, we repeat data from...Ch. 14.4 - In Exercises 14.13414.143, we repeat data from...Ch. 14.4 - In Exercises 14.13414.143, we repeat data from...Ch. 14.4 - In Exercises 14.14414.149, we repeat data from...Ch. 14.4 - In Exercises 14.14414.149, we repeat data from...Ch. 14.4 - In Exercises 14.14414.149, we repeat data from...Ch. 14.4 - Prob. 147ECh. 14.4 - In Exercises 14.14414.149, we repeat data from...Ch. 14.4 - In Exercises 14.14414.149, we repeat data from...Ch. 14.4 - Height and Score. A random sample of 10 students...Ch. 14.4 - Prob. 151ECh. 14.4 - Prob. 152ECh. 14.4 - Prob. 153ECh. 14.4 - Prob. 154ECh. 14.4 - In Exercise 14.154-14.166, use the technology of...Ch. 14.4 - Prob. 156ECh. 14.4 - Prob. 157ECh. 14.4 - Prob. 158ECh. 14.4 - Prob. 159ECh. 14.4 - Prob. 160ECh. 14.4 - Prob. 161ECh. 14.4 - In Exercises 14.154-14.166, use the technology of...Ch. 14.4 - In Exercises 14.15414.166, use the technology of...Ch. 14.4 - Prob. 164ECh. 14.4 - Prob. 165ECh. 14.4 - In Exercises 14.154-14.166, use the technology of...Ch. 14.4 - The coefficient of determination of a set of data...Ch. 14.4 - Country Music Blues. A Knight-Ridder News Service...Ch. 14.4 - Prob. 169ECh. 14.4 - In each of Exercises 14.169 and 14.170, a....Ch. 14 - For a linear equation y = b0 + b1x, identify the ...Ch. 14 - Consider the linear equation y = 4-3x. a. At what...Ch. 14 - In Problems 35, answer true or false to each...Ch. 14 - In Problems 35, answer true or false to each...Ch. 14 - In Problems 35, answer true or false to each...Ch. 14 - Prob. 6RPCh. 14 - In Problems 35, answer true or false to each...Ch. 14 - Prob. 8RPCh. 14 - In each of Problems 911, fill in the blank. 9....Ch. 14 - Prob. 10RPCh. 14 - Prob. 11RPCh. 14 - Prob. 12RPCh. 14 - Prob. 13RPCh. 14 - Prob. 14RPCh. 14 - Prob. 15RPCh. 14 - Prob. 16RPCh. 14 - Prob. 17RPCh. 14 - Prob. 18RPCh. 14 - Prob. 19RPCh. 14 - Equipment Depreciation. A small company has...Ch. 14 - Graduation Rates. Graduation ratethe percentage of...Ch. 14 - Graduation Rates. Refer to Problem 21. a....Ch. 14 - Graduation Rates. Refer to Problem 21. a. Compute...Ch. 14 - Exotic Plants. In the article Effects of Human...Ch. 14 - In Problems 2527, use the technology of your...Ch. 14 - Prob. 26RPCh. 14 - Prob. 27RPCh. 14 - Recall from Chapter 1 (see page 34) that the Focus...Ch. 14 - At the beginning of this chapter, we presented...
Knowledge Booster


Learn more about
Need a deep-dive on the concept behind this application? Look no further. Learn more about this topic, statistics and related others by exploring similar questions and additional content below.Similar questions
- The following fictitious table shows kryptonite price, in dollar per gram, t years after 2006. t= Years since 2006 0 1 2 3 4 5 6 7 8 9 10 K= Price 56 51 50 55 58 52 45 43 44 48 51 Make a quartic model of these data. Round the regression parameters to two decimal places.arrow_forwardFind the equation of the regression line for the following data set. x 1 2 3 y 0 3 4arrow_forwardAccording to the summary result of linear regression model between A and B obtained from R given below, we can fit a regression line. Assume thatA has any value. If we decrease the value of A by 3, how would Y be affected?a) 58.8945 decreaseb) 58.8945 increasec) 29.8827 increased) 49.5142 decreasee) 29.8827 decreasearrow_forward
- Use the following linear regression equation to answer the questions. x3 = −17.3 + 4.1x1 + 9.6x4 − 1.6x7 Suppose x1 and x7 were held at fixed but arbitrary values. a) If x4 increased by 1 unit, what would we expect the corresponding change in x3 to be? b) If x4 increased by 3 units, what would be the corresponding expected change in x3? c) If x4 decreased by 2 units, what would we expect for the corresponding change in x3?arrow_forwardThe table below shows the number of state-registered automatic weapons and the murder rate for several Northwestern states. x y 11.8 14.2 8.4 11.37.1 9.83.9 72.6 5.92.5 6.12.1 5.70.5 4.2 x= thousands of automatic weaponsy = murders per 100,000 residents Determine the regression equation in y = ax + b form and write it below. (Round to 2 decimal places) A) How many murders per 100,000 residents can be expected in a state with 2.2 thousand automatic weapons?Answer = . Round to 3 decimal places.B) How many murders per 100,000 residents can be expected in a state with 1.9 thousand automatic weapons?Answer = .Round to 3 decimal places.arrow_forwardUse the following linear regression equation to answer the questions. x1 = 1.5 + 3.6x2 – 7.8x3 + 1.8x4 Which variables are the explanatory variables? (Select all that apply.) x4x3x2x1 (c) If x2 = 10, x3 = 7, and x4 = 7, what is the predicted value for x1? (Use 1 decimal place.)Suppose x3 and x4 were held at fixed but arbitrary values and x2 increased by 1 unit. What would be the corresponding change in x1?Suppose x2 increased by 2 units. What would be the expected change in x1?Suppose x2 decreased by 4 units. What would be the expected change in x1?(e) Suppose that n = 13 data points were used to construct the given regression equation and that the standard error for the coefficient of x2 is 0.461. Construct a 95% confidence interval for the coefficient of x2. (Use 2 decimal places.) lower limit upper limit (f) Using the information of part (e) and level of significance 1%, test the claim that the coefficient of x2 is different from zero. (Use 2 decimal places.) t t…arrow_forward
- The table below shows the number of state-registered automatic weapons and the murder rate for several Northwestern states. xx 11.7 8.6 6.7 3.5 2.3 2.6 2.2 0.7 yy 14 11 10 7 6.1 6.4 5.9 4.3 xx = thousands of automatic weaponsyy = murders per 100,000 residentsDetermine the regression equation in y = ax + b form and write it below. (Round to 2 decimal places) A) How many murders per 100,000 residents can be expected in a state with 6.5 thousand automatic weapons? Answer = Round to 3 decimal places. B) How many murders per 100,000 residents can be expected in a state with 11 thousand automatic weapons? Answer = Round to 3 decimal places.arrow_forwardAssume that there is a positive linear correlation between the variable R (return rate in percent of financial investment) and the variable t (age in years of the investment) given by the regression equation R = 2.5t + 5.3. 1- If the investment continues to grow at a constant rate, what is the expected return rate when the investment is 7 years old?arrow_forwardUse the following linear regression equation to answer the questions. x1 = 2.0 + 3.6x2 – 7.8x3 + 2.1x4 a) Which variables are the explanatory variables? (Select all that apply.) x3 x1 x2 x4 (b) Which number is the constant term? List the coefficients with their corresponding explanatory variables. constant _____ x2 coefficient _____ x3 coefficient _____ x4 coefficient ______ (c) If x2 = 9, x3 = 3, and x4 = 6, what is the predicted value for x1? (Use 1 decimal place.)arrow_forward
- The managing director of a company wants to find whether there is a relationship between units of a product produced and the profits in a period of 12 months. Month Jan Feb Mar Apr May June July Aug Sept Oct Nov Dec Units produced (X)‘000 2 3 5 8 11 10 12 15 17 18 20 24 Profits (Y) ‘000 3 5 8 11 13 14 16 20 22 24 26 30 i. Calculate the regression equation of the form Y = a + bX and hence estimate the value of the profits when 25,000 units are produced. ii. Calculate the regression equation of the form X = a + bY and hence estimate the value of the units produced when 27,000 in profits is made. iii. Calculate and both the Pearson correlation coefficient and coefficient of determination, interpret both and justify in this case why it would be prudent to rely on the coefficient of determination rather than Pearson in decision…arrow_forwardThe grades of a sample of 9 students on a prelim exam (x) and on the midterm exam (y) are shown below. Find the regression equation. y = 34.661 + 0.433x y = 0.777 + 12.0623x y = 12.0623 + 0.777x y = 34.661 - 0.433xarrow_forwardTo fit a simple linear regression model to the data and to provide its equation (d = a*t + b), along with R2 Day Date Weekday Daily Demand Weekend 1 4/25/2016 Mon 297 0 2 4/26/2016 Tue 293 0 3 4/27/2016 Wed 327 0 4 4/28/2016 Thu 315 0 5 4/29/2016 Fri 348 0 6 4/30/2016 Sat 447 1 7 5/1/2016 Sun 431 1 8 5/2/2016 Mon 283 0 9 5/3/2016 Tue 326 0 10 5/4/2016 Wed 317 0 11 5/5/2016 Thu 345 0 12 5/6/2016 Fri 355 0 13 5/7/2016 Sat 428 1 14 5/8/2016 Sun 454 1 15 5/9/2016 Mon 305 0 16 5/10/2016 Tue 310 0 17 5/11/2016 Wed 350 0 18 5/12/2016 Thu 308 0 19 5/13/2016 Fri 366 0 20 5/14/2016 Sat 460 1 21 5/15/2016 Sun 427 1 22 5/16/2016 Mon 291 0 23 5/17/2016 Tue 325 0 24 5/18/2016 Wed 354 0 25 5/19/2016 Thu 322 0 26 5/20/2016 Fri 405 0 27 5/21/2016 Sat 442 1 28 5/22/2016 Sun 454 1 29 5/23/2016 Mon 318 0 30 5/24/2016 Tue 298 0 31 5/25/2016 Wed 355 0 32 5/26/2016 Thu 355 0 33 5/27/2016 Fri 374 0 34 5/28/2016 Sat 447 1 35 5/29/2016…arrow_forward
arrow_back_ios
SEE MORE QUESTIONS
arrow_forward_ios
Recommended textbooks for you
 Functions and Change: A Modeling Approach to Coll...AlgebraISBN:9781337111348Author:Bruce Crauder, Benny Evans, Alan NoellPublisher:Cengage Learning
Functions and Change: A Modeling Approach to Coll...
Algebra
ISBN:9781337111348
Author:Bruce Crauder, Benny Evans, Alan Noell
Publisher:Cengage Learning
Correlation Vs Regression: Difference Between them with definition & Comparison Chart; Author: Key Differences;https://www.youtube.com/watch?v=Ou2QGSJVd0U;License: Standard YouTube License, CC-BY
Correlation and Regression: Concepts with Illustrative examples; Author: LEARN & APPLY : Lean and Six Sigma;https://www.youtube.com/watch?v=xTpHD5WLuoA;License: Standard YouTube License, CC-BY