
Concept explainers
Videos
When Coastal power stations take in large amounts of cooling water, it is inevitable that a number of fish are drawn in with the water. Twenty-six observations from the article “Multiple
The regression equation is Y = 92.0 − 2.18X1 − 19.2X2 − 9.38X3 + 2.32X4
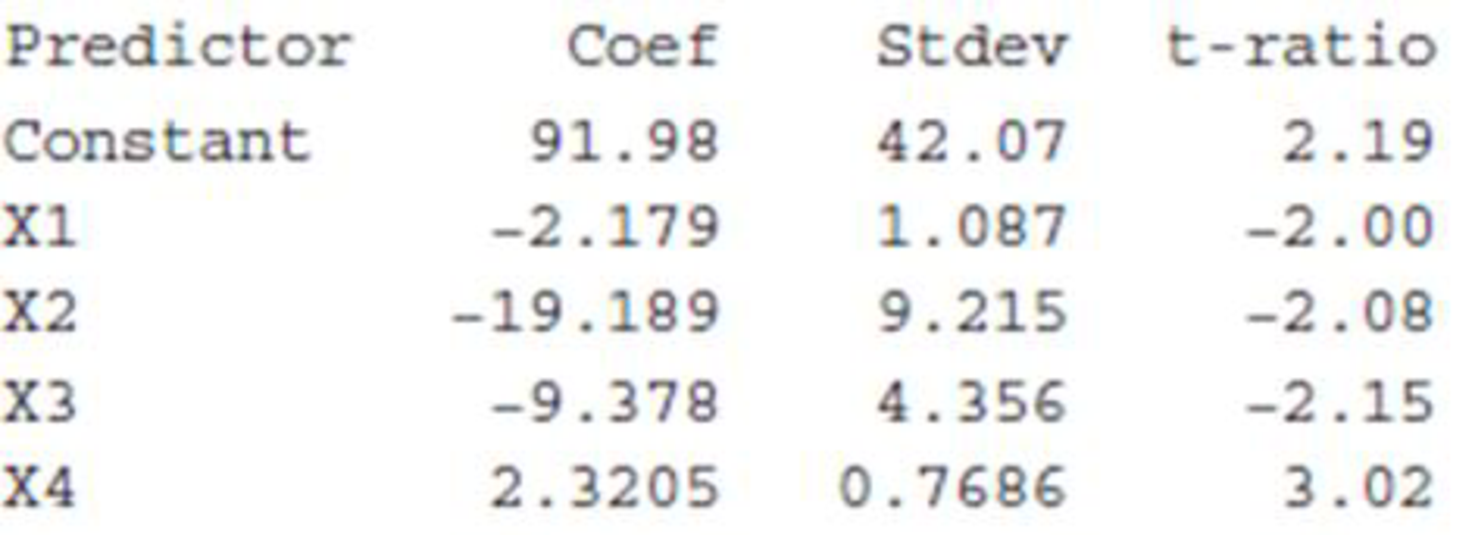
s = 10.53 R–sq = 39.0% R–sq(adj) = 27.3%
- a. Construct a 95% confidence interval for β3, the coefficient of x3 = sea State. Interpret the resulting interval.
- b. Construct a 90%’ confidence interval for the mean change in y associated with a 1° increase in temperature when number of pumps, sea State, and speed remain fixed.

Trending nowThis is a popular solution!

Chapter 14 Solutions
Introduction To Statistics And Data Analysis


- Suppose that researchers are interested in determining the bi-annual salary of statisticians of different levels using their years of experience and their education level (M = bachelors, P = doctorate). They fit the following model to a dataset that includes these variables and, after performing the proper steps of multiple linear regression, the following multiple linear regression model is obtained: yˆ = 42308 + 323x1 + 213x2 + 301(x1*x2) where the variables are as follows: yˆ = predicted bi−annual salary in dollars, x1 = number of years of experiencex2= {1 if the education level is a doctorate 0 if the education level is a bachelors What is the predicted bi-annual salary in dollars of an employee with 5 years of experience and a bachelor’s degree?arrow_forwardSuppose that researchers are interested in determining the bi-annual salary of statisticians of different levels using their years of experience and their education level (M = bachelors, P = doctorate). They fit the following model to a dataset that includes these variables and, after performing the proper steps of multiple linear regression, the following multiple linear regression model is obtained: yˆ = 42308 + 323x1 + 213x2 + 301(x1*x2) where the variables are as follows: yˆ = predicted bi−annual salary in dollars, x1 = number of years of experiencex2= {1 if the education level is a doctorate 0 if the education level is a bachelors What is the predicted bi-annual starting salary of an employee with a doctorate degree? (Someone with no work experience). $ What is the predicted bi-annual starting salary of an employee with a bachelor’s degree? (Someone with no work experience). $arrow_forwardIf the R-squared for a regression model relating the outcome y to an explanatory variable x is 0.9. This implies that y and x are positively correlated.arrow_forward
- It is required to use the data given in the table to estimate the parameters of the simple linear regression equation by any of the estimation methods:arrow_forwardA researcher was investigating variables that might be associated with the academic performance of high school students. The data included the average Math SAS score of all high school seniors in the city that took the exam (labeled as the variable SAT-M), the average number of dollars per pupil spent on education by the city (labeled as the variable $Per Pupil), and the percentage of high school seniors in the city that took the exam (labeled as the variable %Taking). The researcher ran the following multiple linear regression model as SAT-M=Beta0 + Beta1($Per Pupil) + Beta2(%Taking). This model was fit to the data using the method of least-squares, results shown inside of table within photo. If we want to test using ANOVA F-test with hypotheses Ho: Beta1=Beta2=0 versus H1: at least one of the Beta is not 0, what would the value of our F-statistic mean?arrow_forwardIf the R-squared for a regression model relating the outcome y to an explanatory variable x is 0.9. This implies that y and x are positively correlated. True or false?arrow_forward
- Which of the multivariate regression parameters listed below would be best interpreted as: the predicted value on the dependent variable when all of the independent variables in the model are equal to zero. a b1 X1 R2arrow_forwardThe estimated regression equation for a model involving two independentvariables and 65 observations isyˆ = 55.17 + 1.2X1Other statistics produced for the analysis include: SE(b1) = 0.33. Perform a t-test usingthe critical value approach for the significance of β1arrow_forwardSuppose that a regional express delivery service company wants to estimate the cost of shipping a package (Y) as a function of cargo type, where cargo type includes the following possibilities: fragile, semi-fragile, and durable. Costs for 15 randomly chosen packages of approximately the same weight and same distance shipped, but of different cargo types, are provided in the file P14_16.xlsx. a. Estimate a regression equation using the given sample data, and interpret the estimated regression coefficients. b. According to the estimated regression equation, which cargo type is the most costly to ship? Which cargo type is the least costly to ship? c. How well does the estimated equation fit the given sample data? How might the fit be improved? d. Given the estimated regression equation, predict the cost of shipping a package with semi-fragile cargo.arrow_forward
- Would I use the regression line to predict Y from X ? And what is the pattern of the scatterplot?arrow_forwardIs CEO compensation related to a company's performance? To test whether CEO compensation and a company's stock performance are related, a financial analyst collected data on 12 randomly selected, publicly traded companies. For each company, the analyst looked at two variables: the percent change in stock price over the past five years (which she denoted x ) and the percent change in CEO compensation over the past five years (which she denoted y ). For these 12 companies, the least-squares regression equation relating the two variables was =y+−0.1650.046x , and the standard error of the slope of this least-squares regression line was approximately 0.028 . Using her information, test for a significant linear relationship between these two variables by doing a hypothesis test regarding the population slope β1 . (Assume that the variable y follows a normal distribution for each value of x and that the other regression assumptions are satisfied.) Use the…arrow_forwardI have some doubts regarding linear regression. if any 2 variables in X1, X2 AND Y have a positive correlation, then in the linear regression Y = b0 + b1X1 +b2X2 +e, will the sign of b1 and b2 both be positive? will the residuals that we get from linear regression will always be uncorrelated given X?arrow_forward
 MATLAB: An Introduction with ApplicationsStatisticsISBN:9781119256830Author:Amos GilatPublisher:John Wiley & Sons Inc
 Probability and Statistics for Engineering and th...StatisticsISBN:9781305251809Author:Jay L. DevorePublisher:Cengage Learning
 Statistics for The Behavioral Sciences (MindTap C...StatisticsISBN:9781305504912Author:Frederick J Gravetter, Larry B. WallnauPublisher:Cengage Learning
 Elementary Statistics: Picturing the World (7th E...StatisticsISBN:9780134683416Author:Ron Larson, Betsy FarberPublisher:PEARSON
 The Basic Practice of StatisticsStatisticsISBN:9781319042578Author:David S. Moore, William I. Notz, Michael A. FlignerPublisher:W. H. Freeman
 Introduction to the Practice of StatisticsStatisticsISBN:9781319013387Author:David S. Moore, George P. McCabe, Bruce A. CraigPublisher:W. H. Freeman