
Concept explainers
Videos
(a)
Interpretation:
The IR spectrum of the given compound is to be sketched with the X-axis range from
Concept introduction:
IR spectroscopy enables to identify different
One of the greatest advantages of IR spectroscopy is that the frequency of a particular type of vibration is typically found within a characteristic range of frequencies, regardless of the functional group with which the vibration is associated. The fact that absorptions by certain vibrations appear with characteristic frequency ranges enables us to use IR spectroscopy to obtain structural information about a molecule. Stretching vibrations of
Answer to Problem 15.56P
The IR spectrum of the given molecule can be sketched as follows:

Explanation of Solution
The given molecule is
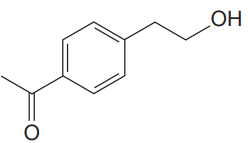
The given molecule has a ketone and alcohol as functional groups. According to Table 15-2, the characteristic frequency of absorption of alcohols
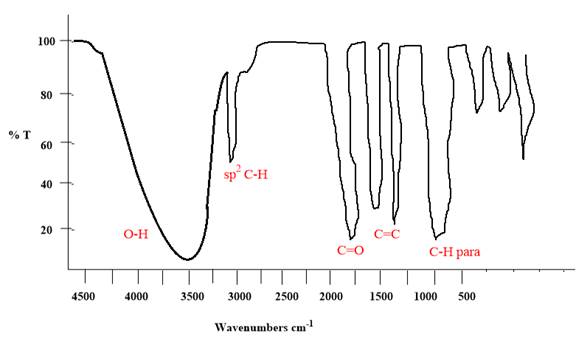
Each significant peak is assigned in the above IR spectrum.
The absorptions by certain vibrations appear with characteristic frequency ranges, enabling us to use IR spectroscopy to obtain structural information about a molecule.
(b)
Interpretation:
The IR spectrum of the given compound is to be sketched with the X-axis range from
Concept introduction:
IR spectroscopy enables to identify different functional groups in the given molecule.
One of the greatest advantages of IR spectroscopy is that the frequency of a particular type of vibration is typically found within a characteristic range of frequencies, regardless of the functional group with which the vibration is associated. The fact that absorptions by certain vibrations appear with characteristic frequency ranges enables us to use IR spectroscopy to obtain structural information about a molecule. Stretching vibrations of
Answer to Problem 15.56P
The IR spectrum of the given molecule can be sketched as follows:

Explanation of Solution
The given molecule is
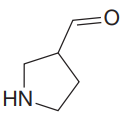
The given molecule has an
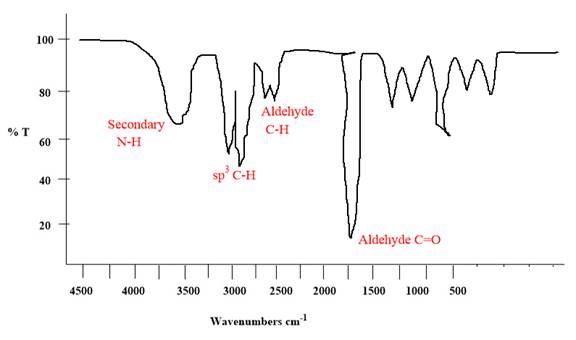
Each significant peak is assigned in the above IR spectrum.
The absorptions by certain vibrations appear with characteristic frequency ranges, enabling us to use IR spectroscopy to obtain structural information about a molecule.
(c)
Interpretation:
The IR spectrum of the given compound is to be sketched with the X-axis range from
Concept introduction:
IR spectroscopy enables to identify different functional groups in the given molecule.
One of the greatest advantages of IR spectroscopy is that the frequency of a particular type of vibration is typically found within a characteristic range of frequencies, regardless of the functional group with which the vibration is associated. The fact that absorptions by certain vibrations appear with characteristic frequency ranges enables us to use IR spectroscopy to obtain structural information about a molecule. Stretching vibrations of
Answer to Problem 15.56P
The IR spectrum of the given molecule can be sketched as follows:
Explanation of Solution
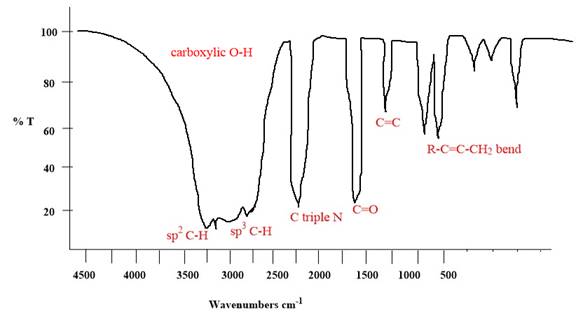
The given molecule is
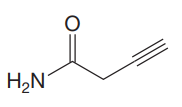
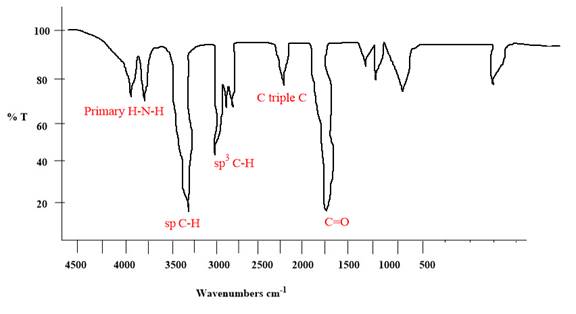
The given molecule has an alkyne and a primary amide as functional groups. According to Table 15-2, the characteristic frequency of absorption of amides
Each significant peak is assigned in the above IR spectrum.
The absorptions by certain vibrations appear with characteristic frequency ranges, enabling us to use IR spectroscopy to obtain structural information about a molecule.
(d)
Interpretation:
The IR spectrum of the given compound is to be sketched with the X-axis range from
Concept introduction:
IR spectroscopy enables to identify different functional groups in the given molecule.
One of the greatest advantages of IR spectroscopy is that the frequency of a particular type of vibration is typically found within a characteristic range of frequencies, regardless of the functional group with which the vibration is associated. The fact that absorptions by certain vibrations appear with characteristic frequency ranges enables us to use IR spectroscopy to obtain structural information about a molecule. Stretching vibrations of
Answer to Problem 15.56P
The IR spectrum of the given molecule can be sketched as follows:
Explanation of Solution
The given molecule is
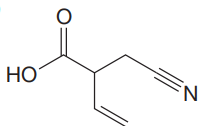
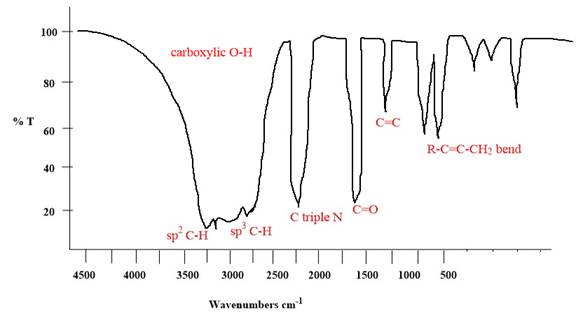
The given molecule has carboxylic acid,
According to Table 15-2, the characteristic frequency of absorption of
Each significant peak is assigned in the above IR spectrum.
The absorptions by certain vibrations appear with characteristic frequency ranges, enabling us to use IR spectroscopy to obtain structural information about a molecule.
Want to see more full solutions like this?
Chapter 15 Solutions
Organic Chemistry: Principles and Mechanisms (Second Edition)


- When measured on a spectrometer operating at 200 MHz, chloroform (CHCl3) shows a single sharp absorption at 7.3 δ. (a) How many parts per million downfield from TMS does chloroform absorb? (b) How many hertz downfield from TMS would chloroform absorb if the measurement were carried out on a spectrometer operating at 360 MHz? (c) What would be the position of the chloroform absorption in δ units when measured on a 360 MHz spectrometer?arrow_forwardAt what approximate positions might the following compounds show IR absorptions?arrow_forwardPredict the structure of the compound using the information below. From IR Spectra: Broad peak at 3500-3200 cm-1 Medium peak at 750 cm-1 From Mass Spectra M+ = 108 M+2 = 110 (with 3:1 peak ratio) From Proton NMR Spectra See attached picture.arrow_forward
- A molecule produces an IR spectrum with key peaks at approximately 3300 and 2100 cm⁻¹. The mass spectrum has a molecular ion with a m/z = 68, and major fragment with m/z of 39. Draw a structure that best fits this data.arrow_forwardPlease list the relevant 1H-NMR peaks.arrow_forward(UV spectroscopy lab, organic chemistry 2) If the extinction coefficient can be calculated from a single absorbance measurement at a known concentration of a compound, why is a calibration curve necessary, even if the measured absorbance is below 1?arrow_forward
- Infrared Interpretation – interpret all absorptions in the 4000-1400 cm-1 region of the IR spectra of 2-methyl-4-heptanol. Label the recorded IR spectra and provide an indication of the impurities present, if any.arrow_forwardBelow are three MS spectra, Spectra 1, 2, and 3. Each of this mass spectrum corresponds to either Compound A (contains one Cl in the molecular formula), Compound B (one I in the molecular formula), and Compound C (one Br in the molecular formula). Identify which spectra corresponds to which compound. Provide explanations for your choices.arrow_forwardSelect the compound that shows an IR absorption near but just above 3000 cm-1arrow_forward
- Based on this 1H-NMR what are the relevant peaks?arrow_forwardPredict the structure of the compound using the information below. Kindly show what information are obtained for each spectra which may help in predicting the structure. From IR Spectra: See the attached picture From Mass Spectra M+ = 134 base peak = 105 peaks at 77 and 51 From Proton and Carbon NMR Spectra See attached picture.arrow_forwardPlease help me identify the functional groups or important peaks of these IR spectra. Thank you!arrow_forward

 Organic Chemistry: A Guided InquiryChemistryISBN:9780618974122Author:Andrei StraumanisPublisher:Cengage Learning