
Statistics for Business & Economics, Revised (MindTap Course List)
12th Edition
ISBN: 9781285846323
Author: David R. Anderson, Dennis J. Sweeney, Thomas A. Williams, Jeffrey D. Camm, James J. Cochran
Publisher: South-Western College Pub
expand_more
expand_more
format_list_bulleted
Concept explainers
Videos
Textbook Question
Chapter 15, Problem 52SE
Recall that in exercise 49, the admissions officer for Clearwater College developed the following estimated regression equation relating final college GPA to the student’s SAT mathematics score and high-school GPA.
where
x1 = high-school grad e point average
x2 = SAT mathematics score
y = final college grade point average
A portion of the Minitab computer output follows.
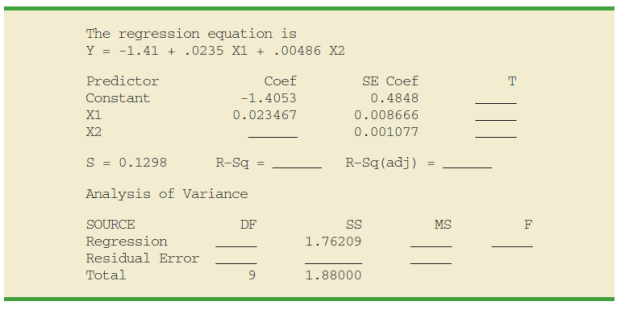
- a. Complete the missing entries in this output.
- b. Use the F test and a .05 level of significance to see whether a significant relationship is present.
- c. Use the t test and α = .05 to test H0: β1 = 0 and H0: β2 = 0.
- d. Did the estimated regression equation provide a good fit to the data? Explain.
Expert Solution & Answer
Want to see the full answer?
Check out a sample textbook solution
Students have asked these similar questions
** had to resubmit this question because the first time the data was duplicated and reflected incorrectly.
The table below gives the number of hours spent unsupervised each day as well as the overall grade averages for seven randomly selected middle school students. Using this data, consider the equation of the regression line, yˆ=b0+b1xy^=b0+b1x, for predicting the overall grade average for a middle school student based on the number of hours spent unsupervised each day. Keep in mind, the correlation coefficient may or may not be statistically significant for the data given. Remember, in practice, it would not be appropriate to use the regression line to make a prediction if the correlation coefficient is not statistically significant.
Hours Unsupervised
1
2
3
4
5
5.5
6
Overall Grades
96
89
87
77
76
68
64
**Please circle the answer for each step so I don't get confused. Thanks in advance for helping me with the breakdown and notes**
Step 1 of 6 :
Find the…
A researcher was interested in investigating whether the parent-child interaction time (in hours) is a predictor of a child's cognitive development. A sample of 9 children shown their parent-child interaction time and cognitive tests scores as below.
1. Base on the regression equation, estimate the predicted cognitive level for a child whose parent interacts with him 6 hours per day?
At a .01 level of significance is there sufficient evidence to conclude that the number of books sold is related to the number of registered students in a straight-line manner, and give the regression equation.
Chapter 15 Solutions
Statistics for Business & Economics, Revised (MindTap Course List)
Ch. 15.2 - The estimated regression equation for a model...Ch. 15.2 - Consider the following data for a dependent...Ch. 15.2 - In a regression analysis involving 30...Ch. 15.2 - A shoe store developed the following estimated...Ch. 15.2 - The owner of Showtime Movie Theaters, Inc., would...Ch. 15.2 - The National Football League (NFL) records a...Ch. 15.2 - PC World rated four component characteristics for...Ch. 15.2 - The Cond Nast Traveler Gold List provides ratings...Ch. 15.2 - Waterskiing and wakeboarding are two popular...Ch. 15.2 - Prob. 10E
Ch. 15.3 - In exercise 1, the following estimated regression...Ch. 15.3 - Prob. 12ECh. 15.3 - In exercise 3, the following estimated regression...Ch. 15.3 - In exercise 4, the following estimated regression...Ch. 15.3 - In exercise 5, the owner of Showtime Movie...Ch. 15.3 - In exercise 6, data were given on the average...Ch. 15.3 - Prob. 17ECh. 15.3 - Prob. 18ECh. 15.5 - In exercise 1, the following estimated regression...Ch. 15.5 - Refer to the data presented in exercise 2. The...Ch. 15.5 - The following estimated regression equation was...Ch. 15.5 - In exercise 4, the following estimated regression...Ch. 15.5 - Prob. 23ECh. 15.5 - The Wall Street Journal conducted a study of...Ch. 15.5 - The Cond Nast Traveler Gold List for 2012 provided...Ch. 15.5 - In exercise 10, data showing the values of several...Ch. 15.6 - In exercise 1, the following estimated regression...Ch. 15.6 - Refer to the data in exercise 2. The estimated...Ch. 15.6 - In exercise 5, the owner of Showtime Movie...Ch. 15.6 - Prob. 30ECh. 15.6 - The American Association of Individual Investors...Ch. 15.7 - Consider a regression study involving a dependent...Ch. 15.7 - Consider a regression study involving a dependent...Ch. 15.7 - Management proposed the following regression model...Ch. 15.7 - Refer to the Johnson Filtration problem introduced...Ch. 15.7 - This problem is an extension of the situation...Ch. 15.7 - The Consumer Reports Restaurant Customer...Ch. 15.7 - A 10-year study conducted by the American Heart...Ch. 15.8 - Data for two variables, x and y, follow. xi 1 2 3...Ch. 15.8 - Data for two variables, x and y, follow. xi 22 24...Ch. 15.8 - Exercise 5 gave the following data on weekly gross...Ch. 15.8 - The following data show the curb weight,...Ch. 15.8 - Prob. 43ECh. 15.9 - Refer to the Simmons Stores example introduced in...Ch. 15.9 - In Table 15.12 we provided estimates of the...Ch. 15.9 - Community Bank would like to increase the number...Ch. 15.9 - Over the past few years the percentage of students...Ch. 15.9 - The Tire Rack maintains an independent consumer...Ch. 15 - The admissions officer for Clearwater College...Ch. 15 - The personnel director for Electronics Associates...Ch. 15 - A partial computer output from a regression...Ch. 15 - Recall that in exercise 49, the admissions officer...Ch. 15 - Recall that in exercise 50 the personnel director...Ch. 15 - The Tire Rack, Americas leading online distributor...Ch. 15 - The Department of Energy and the U.S....Ch. 15 - A portion of a data set containing information for...Ch. 15 - Fortune magazine publishes an annual list of the...Ch. 15 - Consumer Research, Inc., is an independent agency...Ch. 15 - Matt Kenseth won the 2012 Daytona 500, the most...Ch. 15 - Finding the Best Car Value When trying to decide...
Knowledge Booster


Learn more about
Need a deep-dive on the concept behind this application? Look no further. Learn more about this topic, statistics and related others by exploring similar questions and additional content below.Similar questions
- If your graphing calculator is capable of computing a least-squares sinusoidal regression model, use it to find a second model for the data. Graph this new equation along with your first model. How do they compare?arrow_forwardFind the equation of the regression line for the following data set. x 1 2 3 y 0 3 4arrow_forwardOlympic Pole Vault The graph in Figure 7 indicates that in recent years the winning Olympic men’s pole vault height has fallen below the value predicted by the regression line in Example 2. This might have occurred because when the pole vault was a new event there was much room for improvement in vaulters’ performances, whereas now even the best training can produce only incremental advances. Let’s see whether concentrating on more recent results gives a better predictor of future records. (a) Use the data in Table 2 (page 176) to complete the table of winning pole vault heights shown in the margin. (Note that we are using x=0 to correspond to the year 1972, where this restricted data set begins.) (b) Find the regression line for the data in part ‚(a). (c) Plot the data and the regression line on the same axes. Does the regression line seem to provide a good model for the data? (d) What does the regression line predict as the winning pole vault height for the 2012 Olympics? Compare this predicted value to the actual 2012 winning height of 5.97 m, as described on page 177. Has this new regression line provided a better prediction than the line in Example 2?arrow_forward
- A researcher examined the relationship between the annual tax amount paid by the construction company owners and the total expense items spent for the construction with regression analysis and calculated the regression line estimation as Y=6+2X. According to this; Write the interpretations of the cutoff and regression parameters, respectively, in your OWN SENTENCES in a statistically appropriate way over the tax amount and expenses.arrow_forwardYou spilled water on your calculations from (a) and can't remember what your estimated regression parameters are. But you do have two possible estimated errors for each of your initial four observations:arrow_forwardThe product manager for a brand of all-natural herbal shampoo has compiled 15 weeks of data on the weekly sales of the brand (in units), the level of media advertising (in thousands of dollars), the price (in dollars), and the use of displays (in number of stores with the brand on an end-aisle display). She then carried out a multiple regression analysis on these data in order to calculate a price elasticity. Her data and the results of the regression analysis can be seen below. Name each of the variables that were used in this multiple regression analysis. For each of these variables, indicate whether it was an independent variable or a dependent variable in this regression analysis. Use these data and the results of the regression analysis to calculate the price elasticity for this shampoo brand. Show your work. Based on the course material, describe two issues that should lead the product manager to not entirely trust the price elasticity calculated from this analysis.arrow_forward
- A real estate analyst has developed a multiple regression line, y = 60 + 0.068 x1 – 2.5 x2, to predict y = the market price of a home (in $1,000s), using two independent variables, x1 = the total number of square feet of living space, and x2 = the age of the house in years. With this regression model, the predicted price of a 10-year old home with 2,500 square feet of living area is __________. $205.00 $200,000.00 $205,000.00 $255,000.00arrow_forwardWould I use the regression line to predict Y from X ? And what is the pattern of the scatterplot?arrow_forwardA study in the univeristy of massachusetts amherst published in the may 2007 journal of marriage and family found that married women do about one fewer hour of housework a week for every $7500 they earn as a full time workers outside of the home, regardless of their husband's income A) what would be the numerical value of the slope coefficient in the regression model that predicts womens housework hours from their income? what does the sign of the slope (positive or negative) tell us about the relationship between these variables B) Suppose Lynette's salary is $30,000 greater than Gabriells. what would you predict the difference in hours of housework they each do.arrow_forward
- A social scientist collects information about counties in California and finds that the correlation between average income of the county and a rating of healthcare quality in the county is 0.78. A scatterplot of the two variables is football shaped. A particular county has an average income that is 0.4 SDs above the average of all counties. Using regression, we would predict that its healthcare quality is _________ SDs above the average healthcare quality for all counties, and that it is therefore at the _________ percentile of healthcare quality among all counties. Choose the answer below to fill in the two blanks. Group of answer choices 0.31; 24th 0.78; 58th 0.78; 79th 0.31; 62nd PreviousNextarrow_forwardShow that the regression line that runs through the standardized data values has the formarrow_forwardThe owner of Original Italian Pizza restaurant chain wants to understand which variable most strongly influences the sales of his specialty deep-dish pizza. He has gathered data on the monthly sales of deep-dish pizzas at his restaurants and observations on other potentially relevant variables for each of several outlets in central Indiana. These data are provided in the file P10_04.xlsx. Estimate a simple linear regression equation between the quantity sold (Y) and each of the following candidates for the best explanatory variable: average price of deep-dish pizzas (X1), monthly advertising expenditures (X2), and disposable income per household in the areas surrounding the outlets (X3). Round your answers for intercept coefficients to the nearest whole number and slope coefficients to two decimal places, if necessary. If your answer is negative number, enter "minus" sign.arrow_forward
arrow_back_ios
SEE MORE QUESTIONS
arrow_forward_ios
Recommended textbooks for you
 College AlgebraAlgebraISBN:9781305115545Author:James Stewart, Lothar Redlin, Saleem WatsonPublisher:Cengage Learning
 Algebra and Trigonometry (MindTap Course List)AlgebraISBN:9781305071742Author:James Stewart, Lothar Redlin, Saleem WatsonPublisher:Cengage Learning
 Trigonometry (MindTap Course List)TrigonometryISBN:9781305652224Author:Charles P. McKeague, Mark D. TurnerPublisher:Cengage Learning
 Functions and Change: A Modeling Approach to Coll...AlgebraISBN:9781337111348Author:Bruce Crauder, Benny Evans, Alan NoellPublisher:Cengage Learning
College Algebra
Algebra
ISBN:9781305115545
Author:James Stewart, Lothar Redlin, Saleem Watson
Publisher:Cengage Learning
Algebra and Trigonometry (MindTap Course List)
Algebra
ISBN:9781305071742
Author:James Stewart, Lothar Redlin, Saleem Watson
Publisher:Cengage Learning
Trigonometry (MindTap Course List)
Trigonometry
ISBN:9781305652224
Author:Charles P. McKeague, Mark D. Turner
Publisher:Cengage Learning
Functions and Change: A Modeling Approach to Coll...
Algebra
ISBN:9781337111348
Author:Bruce Crauder, Benny Evans, Alan Noell
Publisher:Cengage Learning
Correlation Vs Regression: Difference Between them with definition & Comparison Chart; Author: Key Differences;https://www.youtube.com/watch?v=Ou2QGSJVd0U;License: Standard YouTube License, CC-BY
Correlation and Regression: Concepts with Illustrative examples; Author: LEARN & APPLY : Lean and Six Sigma;https://www.youtube.com/watch?v=xTpHD5WLuoA;License: Standard YouTube License, CC-BY